

INTRODUCTION
Kazakhstan’s rapid economic growth, driven by fossil fuel and metal exports, stems from Soviet-era industrialization, which prioritized expansion over environmental concerns. Decades of mismanagement have led to severe pollution, ranking Kazakhstan 23rd globally for PM2.5 levels (IQAir, 2021).
Climate & Administrative Structure
As the world’s largest landlocked nation, Kazakhstan consists of 17 regions and three independent city-regions (Astana, Almaty, Shymkent). Its diverse geography includes grasslands (70%), deserts (22%), forests (3%), and water bodies (2%).
Interplay of Climate Change & Air Pollution
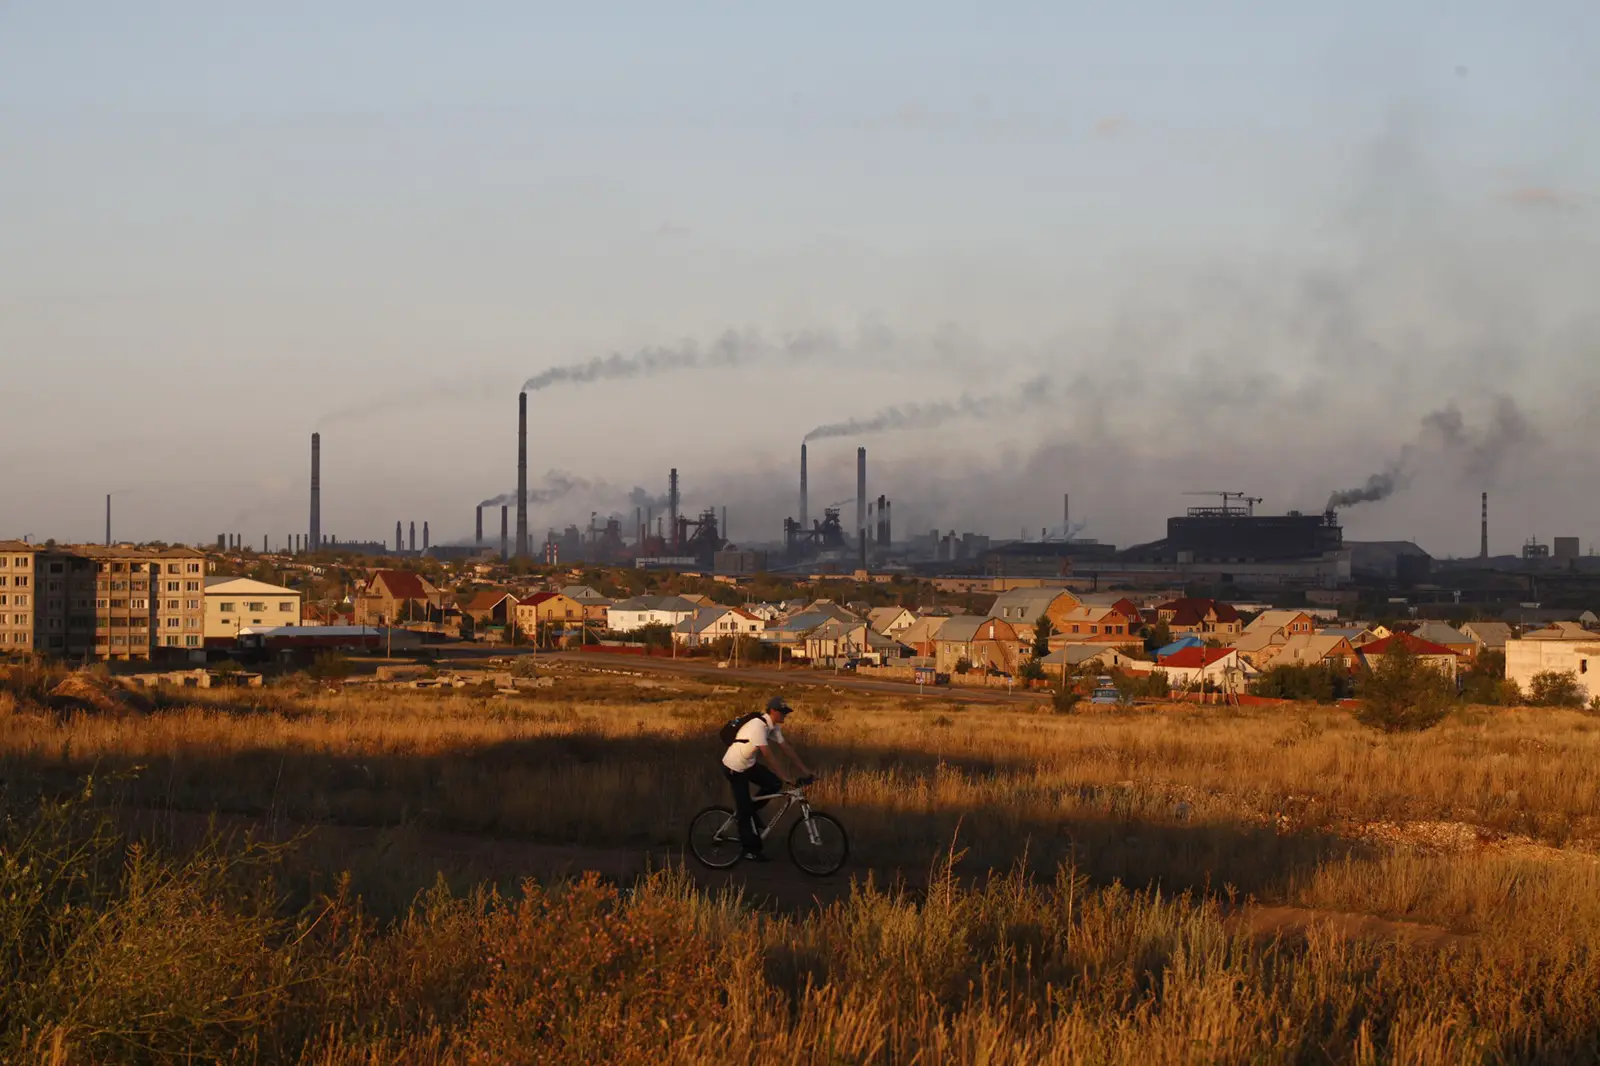
In 2019, Kazakhstan was the 21st largest CO2 emitter, primarily from fossil fuels. Extreme pollution events, such as “black snow” in Temirtau, highlight the link between industrial smog and climate change. While environmental laws have improved, more action is needed to integrate climate data effectively.
Key Pollutants & Sources
Nitrogen Dioxide (NO2)
Comes from vehicle emissions, coal-fired power plants, and metal refining. Causes respiratory issues and acid rain.
Methane (CH4)
80x more potent than CO2 in warming. Major sources: agriculture (40%), fossil fuels (35%), waste (25%).
Sulphur Dioxide (SO2)
From coal plants and industrial processes, causing respiratory problems and acid rain.
Particulate Matter (PM10)
From transport, industry, construction, and dust storms, affecting respiratory and cardiovascular health.
Air Pollution from Mining Activities
Key affected regions: Karaganda, East Kazakhstan, Pavlodar, Atyrau. The Karaganda Coal Basin and copper smelters in Balkhash and Zhezkazgan produce NO2 and SO2, while Atyrau’s oil fields emit methane. Power and metallurgy contribute 67% of Kazakhstan’s industrial emissions.
Air Pollution Limits & Monitoring
Kazhydromet monitors air quality, but integration of data remains weak. Kazakhstan’s pollutant limits exceed WHO recommendations (Tab. 1). The first COVID –19 lockdown (March-May 2020) temporarily reduced emissions.
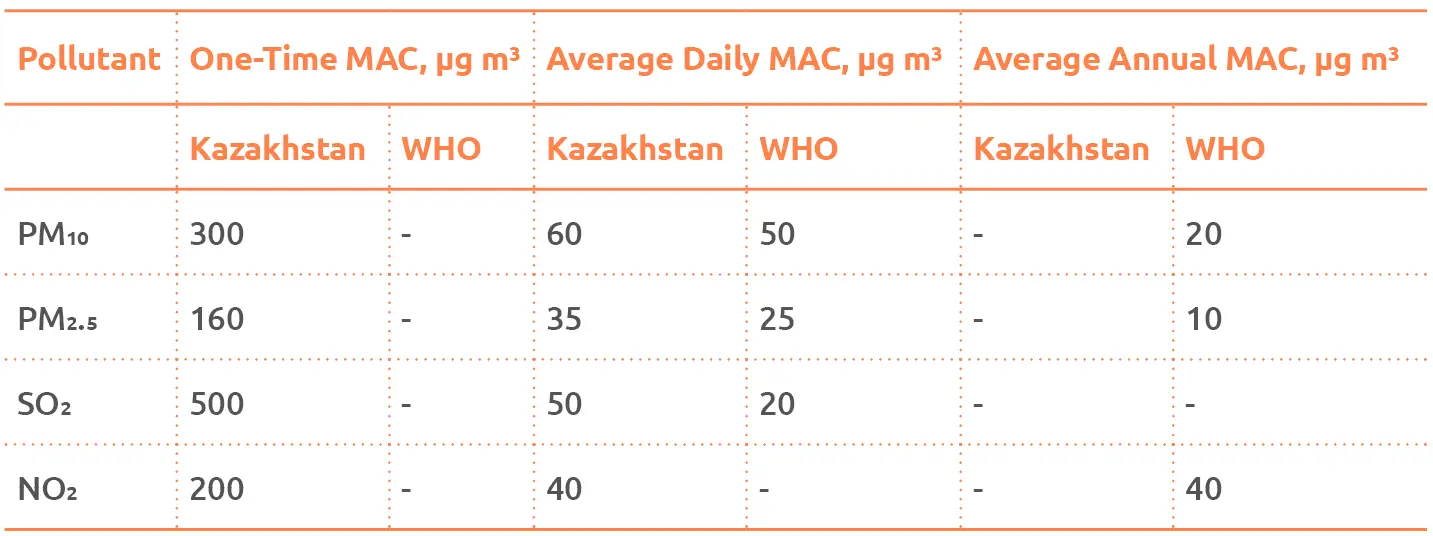
Tab. 1: Limit values of pollutants in the air according to the WHO and Kazakhstan’s national standards. The abbreviation "MAC" in the context of air quality typically refers to Maximum Allowable Concentration, and when expressed in micrograms per cubic meter (µg/m³), it indicates the permissible level of a specific pollutant in the air. This measure is used to assess and regulate air quality to protect public health and the environment. The annual average MAC is the average concentration of a pollutant over an entire year, and it is often used as a long-term indicator of air quality. Source: Assanov, 2021.
Kazakhstan must strengthen air quality regulations, shift from coal to renewables, and enhance environmental data accessibility to combat air pollution.
DATA AND METHODOLOGY
Sentinel-5P (S5P)
Sentinel-5P (S5P) is a satellite devoted to atmosphere monitoring, launched in October 2017 as a part of the EU Co-pernicus Programme. It carries a TROPOMI spectrometer (TROPOspheric Monitoring Instrument) covering wave-length bands between the ultravioletand the shortwave infrared. S5P measures gases such as NO2, ozone, formaldehyde, SO2, methane, carbon monoxide, and aerosols daily, with a spatial resolution of about 5.5 km x 3.5 km (~7km to ~5.5 km until August 2019).
Copernicus Atmosphere Monitoring Service (CAMS)
The monitoring of particulate matter (PM10) and sulphur dioxide (S02) concentrations was obtained through the Copernicus Atmosphere Monitoring Service (CAMS). CAMS, a part of the Copernicus Programme implemented by the European Centre for Medium-Range Weather Forecasts (ECMWF), provides global, quality-controlled information related to air pollution, solar energy, greenhouse gases, and climate forcing.
Outline of processing
All the data was automatically downloaded and preprocessed using our proprietary Python scripts and the SH service for the study period, May 2018-December 2022. The final processing steps were executed on a desktop GIS. In maps and graphs, the pollutants were given in the following units:
• NO2 and CO in 10-4 mol/m2
• PM10 and SO2 in μg/m3
• CH4 in parts per billion (ppb), which is more commonly used in the context of concentrations of this pollutant (the original values were divided by 0.0045 to get ppb)
RESULTS
Almaty (most populated city in Kazakhstan) – Major coal plant power stations. Major source of NO2 and SO2 emissions. PM10 also form natural sources more in the south from dust storms and industry, transport sources from poorly maintained vehicles all combined.
“Black Snow”/ coloured snow events occur here caused by emissions from metallurgy and mining and highlighting the interplay and overlap between Climate Change and air pollution. Additionally the largest metallurgy industrial site owned by company ArcelorMittal Temirtau is located here a major air pollution source.
Major air pollution sources of PM10, NO2 from transport, especially badly maintained old vehilces, coal burning power stations and domestic heating in winter, smog
Ekibastuz: GRES-1 (also known as: AES-Ekibastuz) is a 4,000 MW coal-fired thermal power station. It is located by lake Zhyngyldy. The ashes of the station are dumped into nearby lake Karasor. GRES-1 has two 330-metre tall chimneys. It is the most powerful coal-fired plant in Kazakhstan and a significant producer of SO2.
Bogatyr Coal Mine, Type: Open Pit, Operations started in 1979, largest in Kazakhstan, production in 2023 of saleable coal: 31.43 mil. t. per annum (GemWiki 2025). Main sources of: SO2, NO2 emissions: Coal mining, coal burnt power stations, domestic heating in Winter.
Oil fields and gas fields cause large emissions of CH4, also in Aktau and Taraz.
The highest concentrations of PM10 in the country, because of natural sources of dust, from dust storms and desert areas. The whole of South Kazakhstan has this problem.
Oskemen Large coal mining activities and coal-fired power plants producing large emissions of NO2 and SO2.
The Karaganda Oblast, a important major industrial heartland, major source of air pollution from coal mining, coal fired power stations, metallurgy and domestic heating acitivies.
The largest copper smelting plant in Kazakhstan – Kazakhmys owned site and the copper smelter plant in Zhezqazghan city are huge emitters of SO2.
The largest copper smelting plant in Kazakhstan – Kazakhmys owned site and the copper smelter plant in Zhezqazghan city are huge emitters of SO2.
Major sources of SO2 and NO2 from coal powered plants, emissions from transport and coal mining.
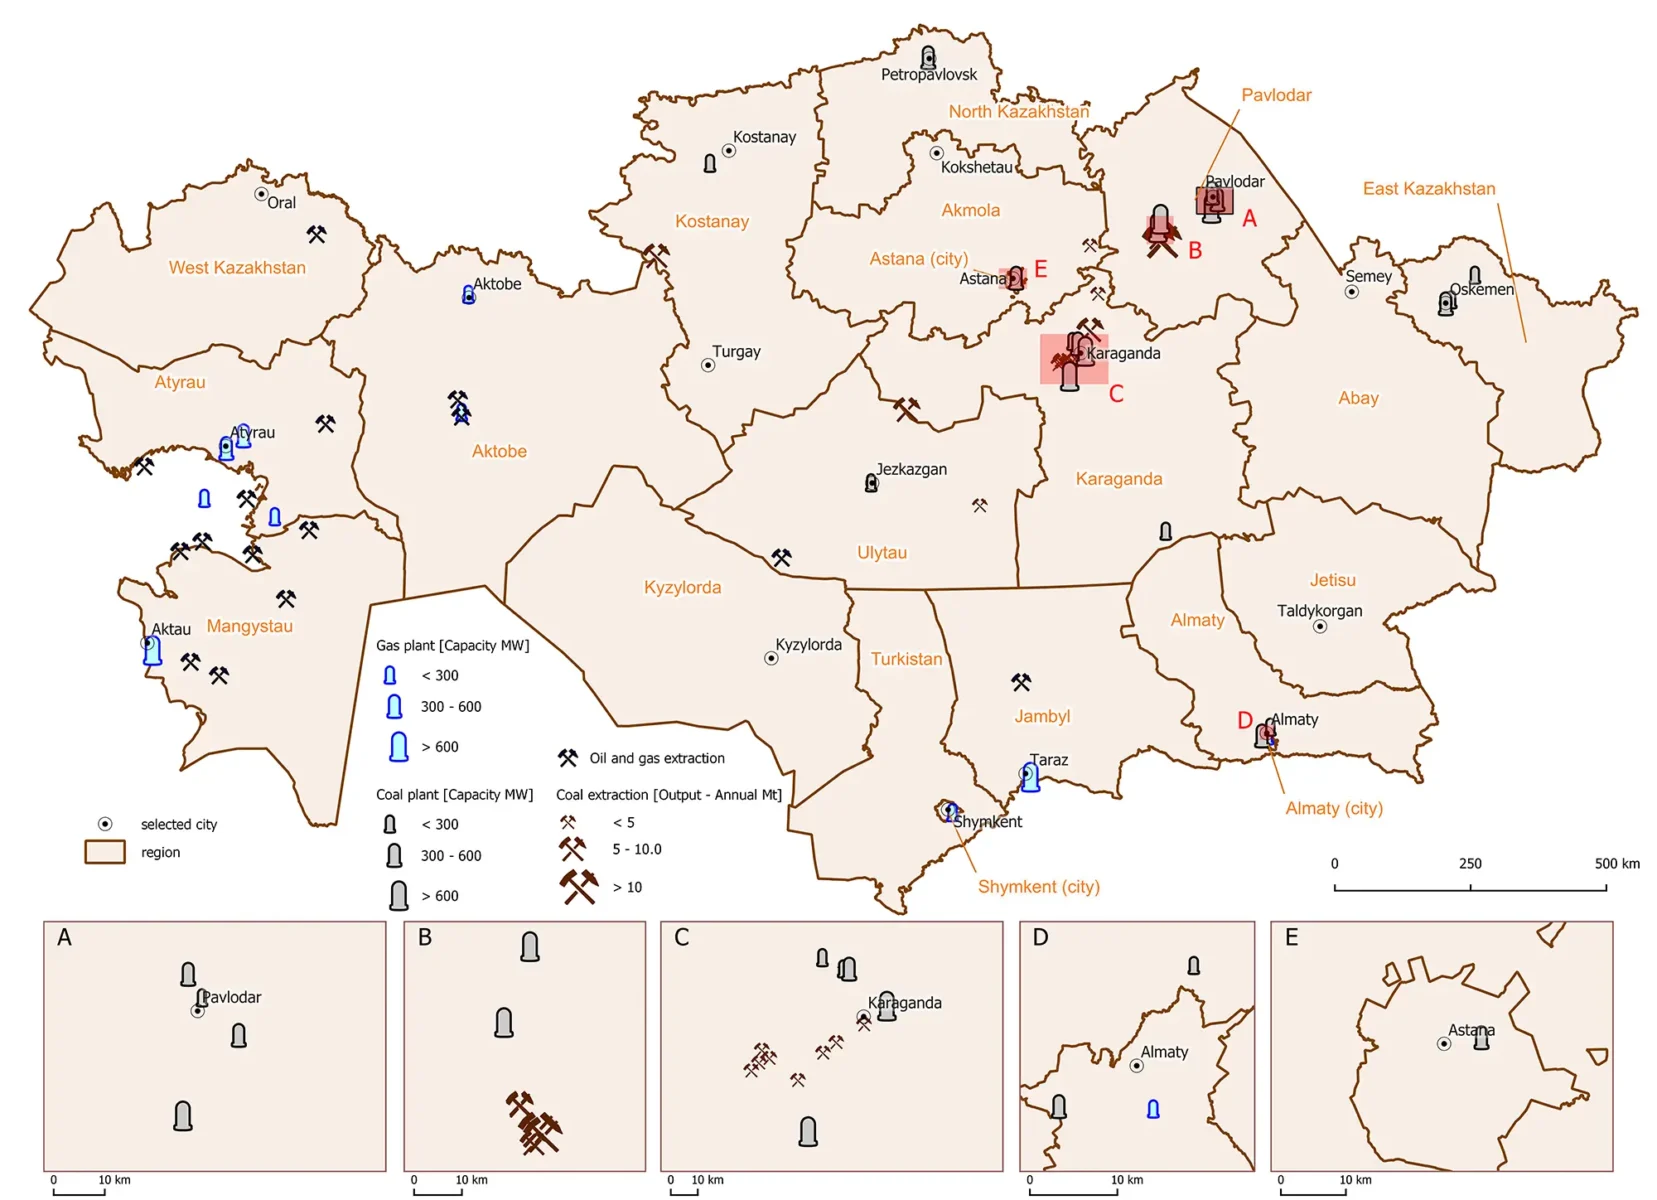
Fig. 1: Distribution of major coal mining and oil and gas extraction sites in Kazakhstan. Source: Global Energy Monitor, 2022.
Nitrogen Dioxide (NO2)
Highest NO2 concentrations are found in Almaty, Astana, and Shymkent, as well as Pavlodar, Turkistan, and North Kazakhstan regions.
The main sources include transportation and industry, exacerbated by outdated vehicles and inefficient public transport.
Almaty City
Conc. NO2 (10-4 mol/m2) – 0.38
Major sources: Crossborder emissions from Uzbekistan, transport and coal mining / power plants.
Shymkent City
Conc. NO2 (10-4 mol/m2) – 0.79
Major sources: Crossborder emissions from Uzbekistan, transport and coal mining / power plants.
Astana City
Conc. NO2 (10-4 mol/m2) – 1.32
Major sources: Coal mining activites and coal-fired power plants, transport (badly maintained and old vehicles), domestic heating (in winter).
Pavlodar Region
High levels of NO2 caused primarily by coal mining and coal-fired power plants.
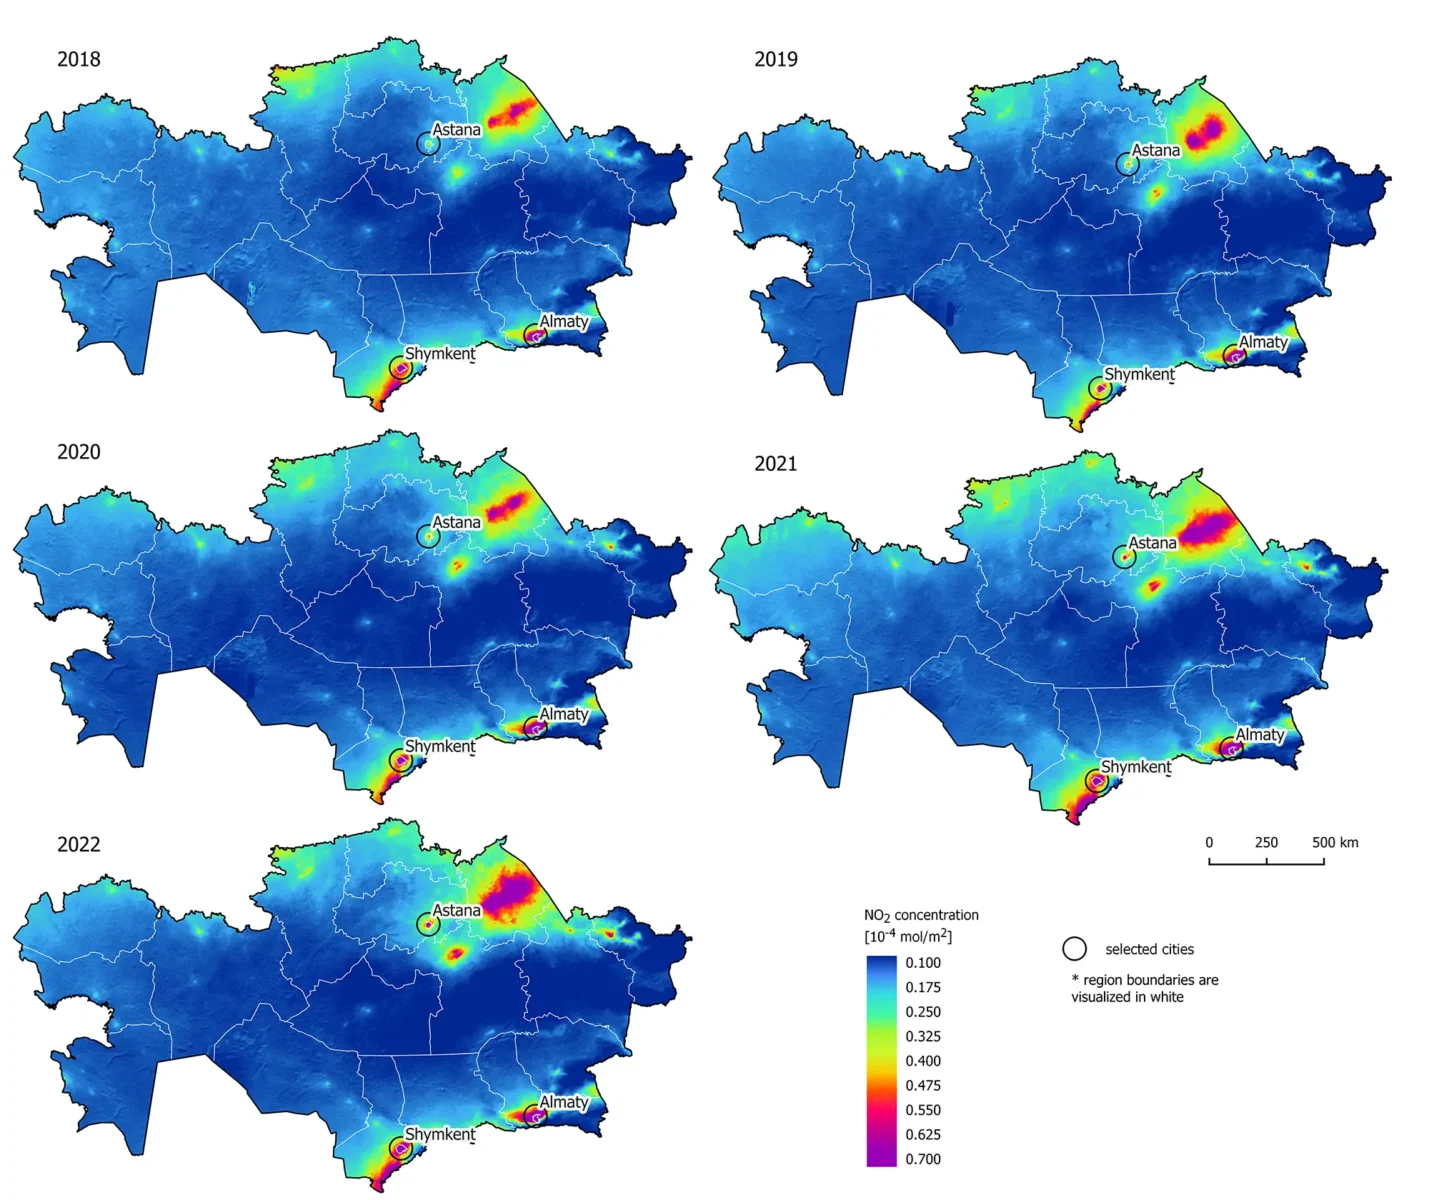
Fig. 2: Average yearly NO2 concentrations in Kazakhstan between May 2018 and December 2022, obtained from the Sentinel-5P satellite. Sources: Copernicus Sentinel data (ESA, 2018–2022, modified); OpenStreetMap contributors, 2022.
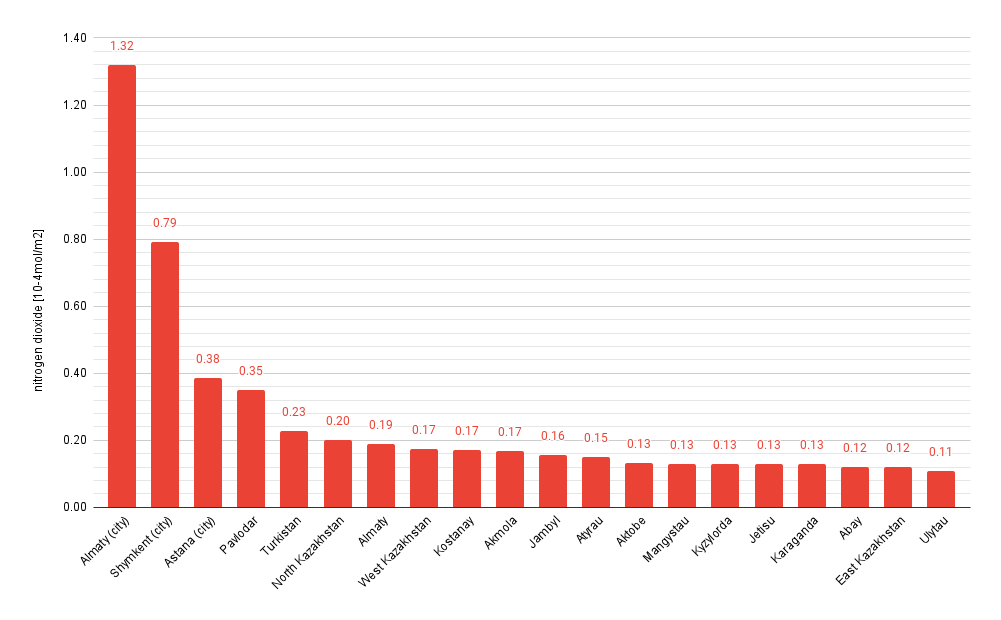
Fig. 3: Average NO2 concentrations in the regions of Kazakhstan between May 2018 and December 2022, obtained from the Sentinel-5P satellite. Sources: Copernicus Sentinel data (ESA, 2018–2022; modified); OpenStreetMap contributors, 2022.
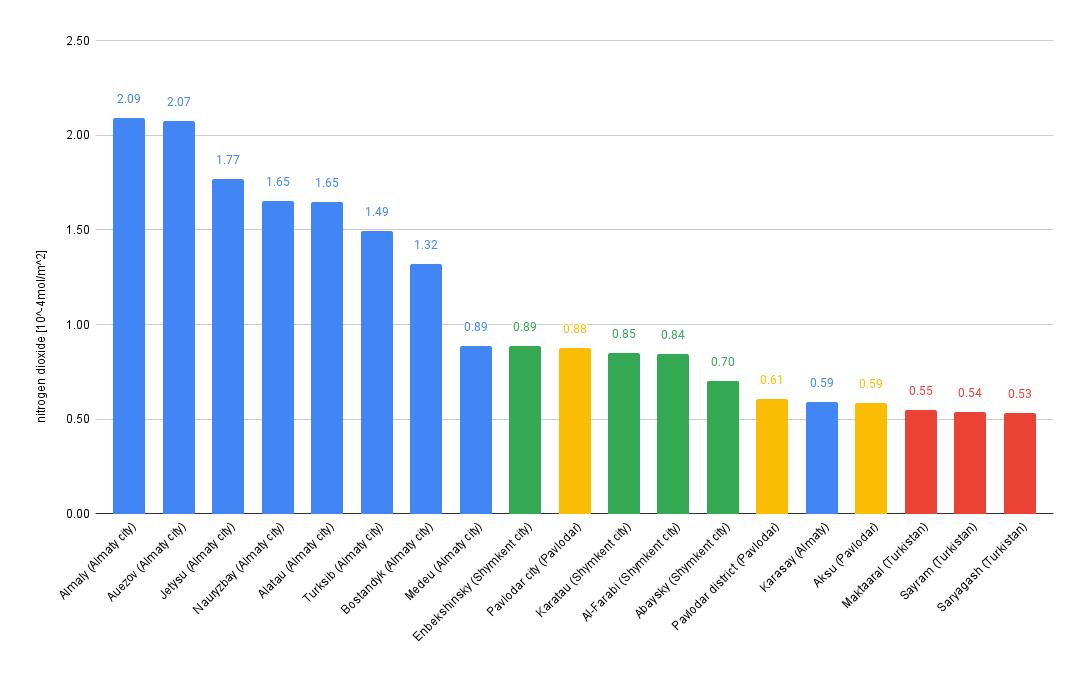
Fig. 4: 20 highest NO2 concentrations in the districts of Kazakhstan (with indication of the region – the columns are coloured, each colour refers to a region of the country) between May 2018 and December 2022, obtained from the Sentinel-5P satellite. Sources: Copernicus Sentinel data (ESA, 2018–2022; modified); OpenStreetMap contributors, 2022.
COVID-19 lockdowns led to significant reductions in NO2, particularly in major cities and industrial areas.
Pavlodar an important industrial region mainly for coal mining and coal-fired power stations.
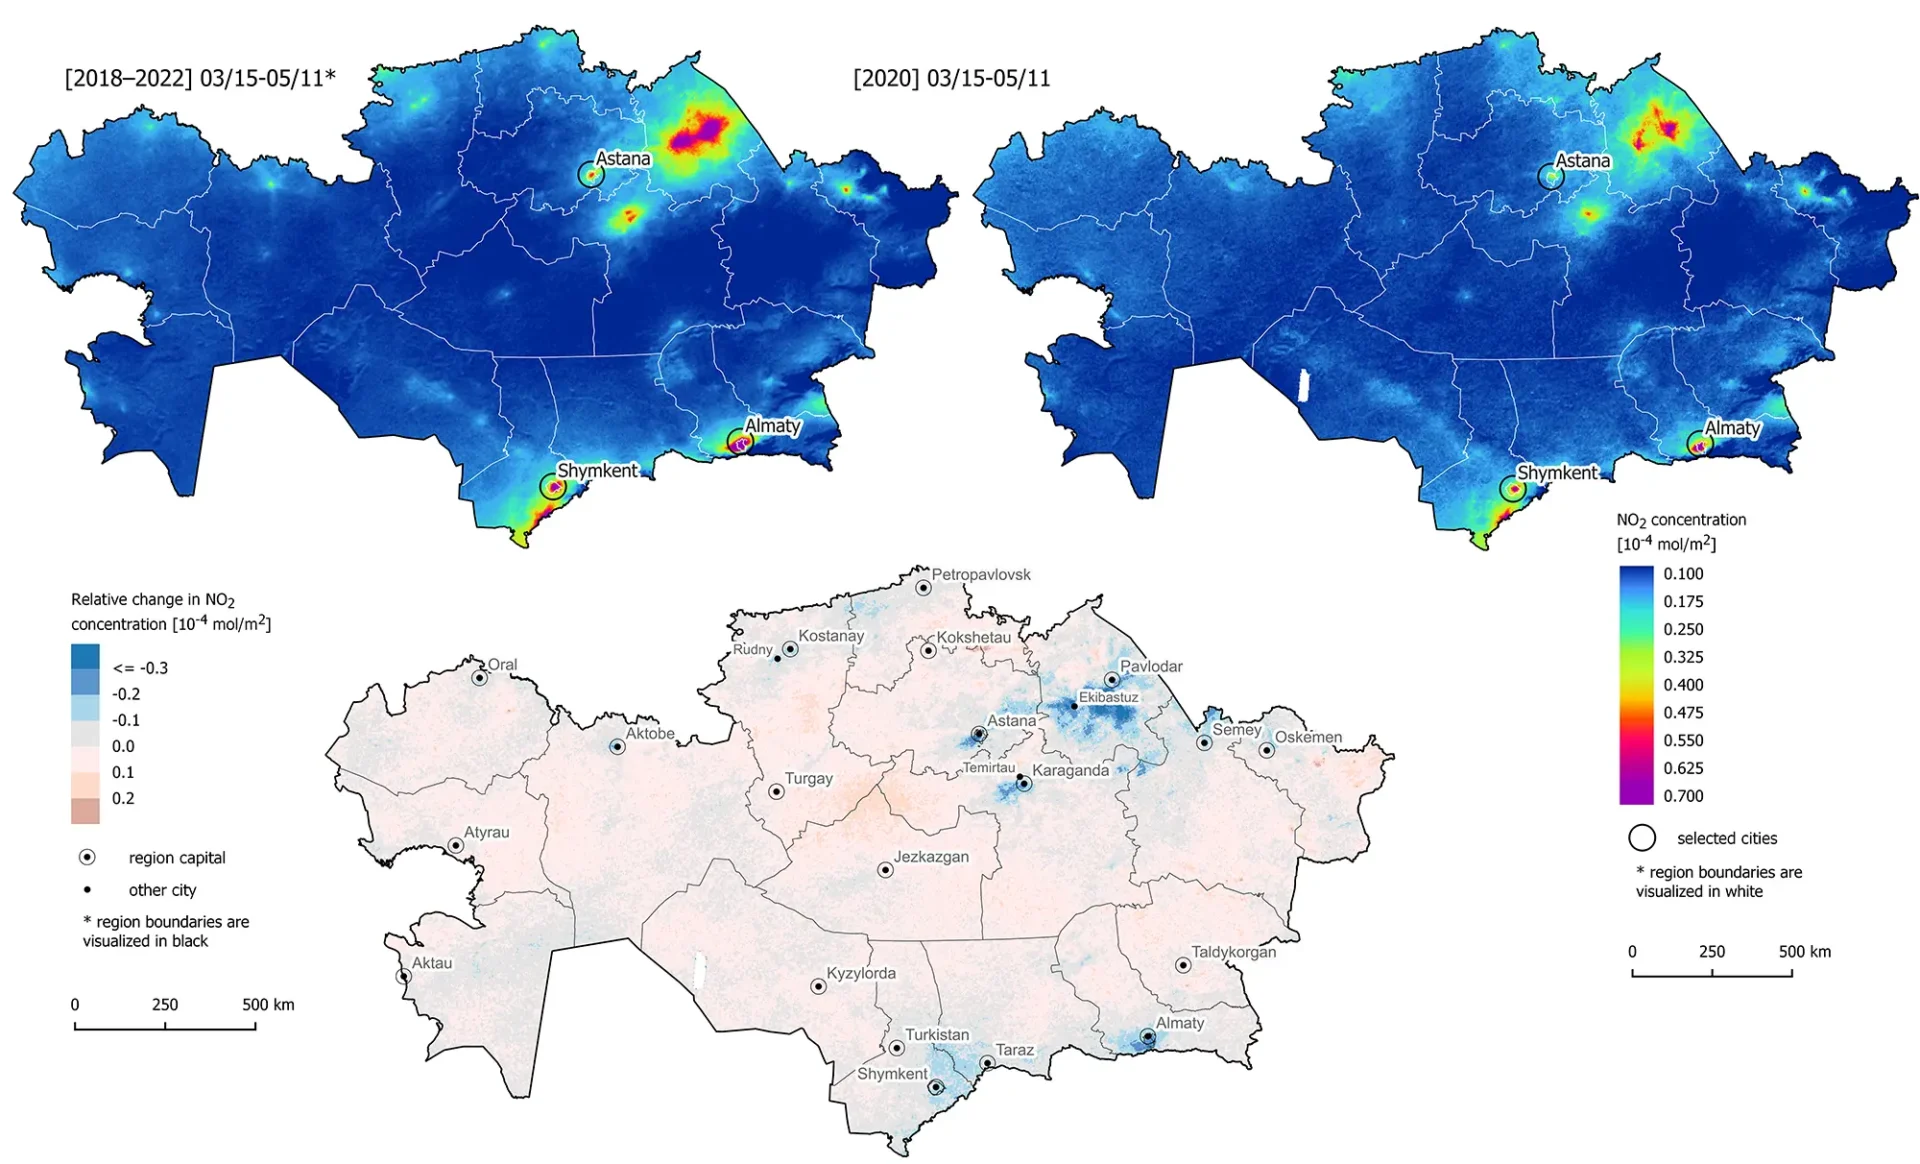
Note: Average emission concentrations have reduced in 2020 due to lack of human activities during lockdowns and a reduction in operations. From 2018 – 2022 average levels (even including the COVID-19 period) were considerably higher, (left hand map).
Fig. 5: NO2 concentrations for the main COVID-19 period of March 15-May 11, averaged for 2020 (right) and for 2018-2019/2021-2022 (left). The difference in the averages is in the bottom map. Obtained from the Sentinel-5P satellite. Sources: Copernicus Sentinel data (ESA, 2018–2022; modified); OpenStreetMap contributors, 2022.
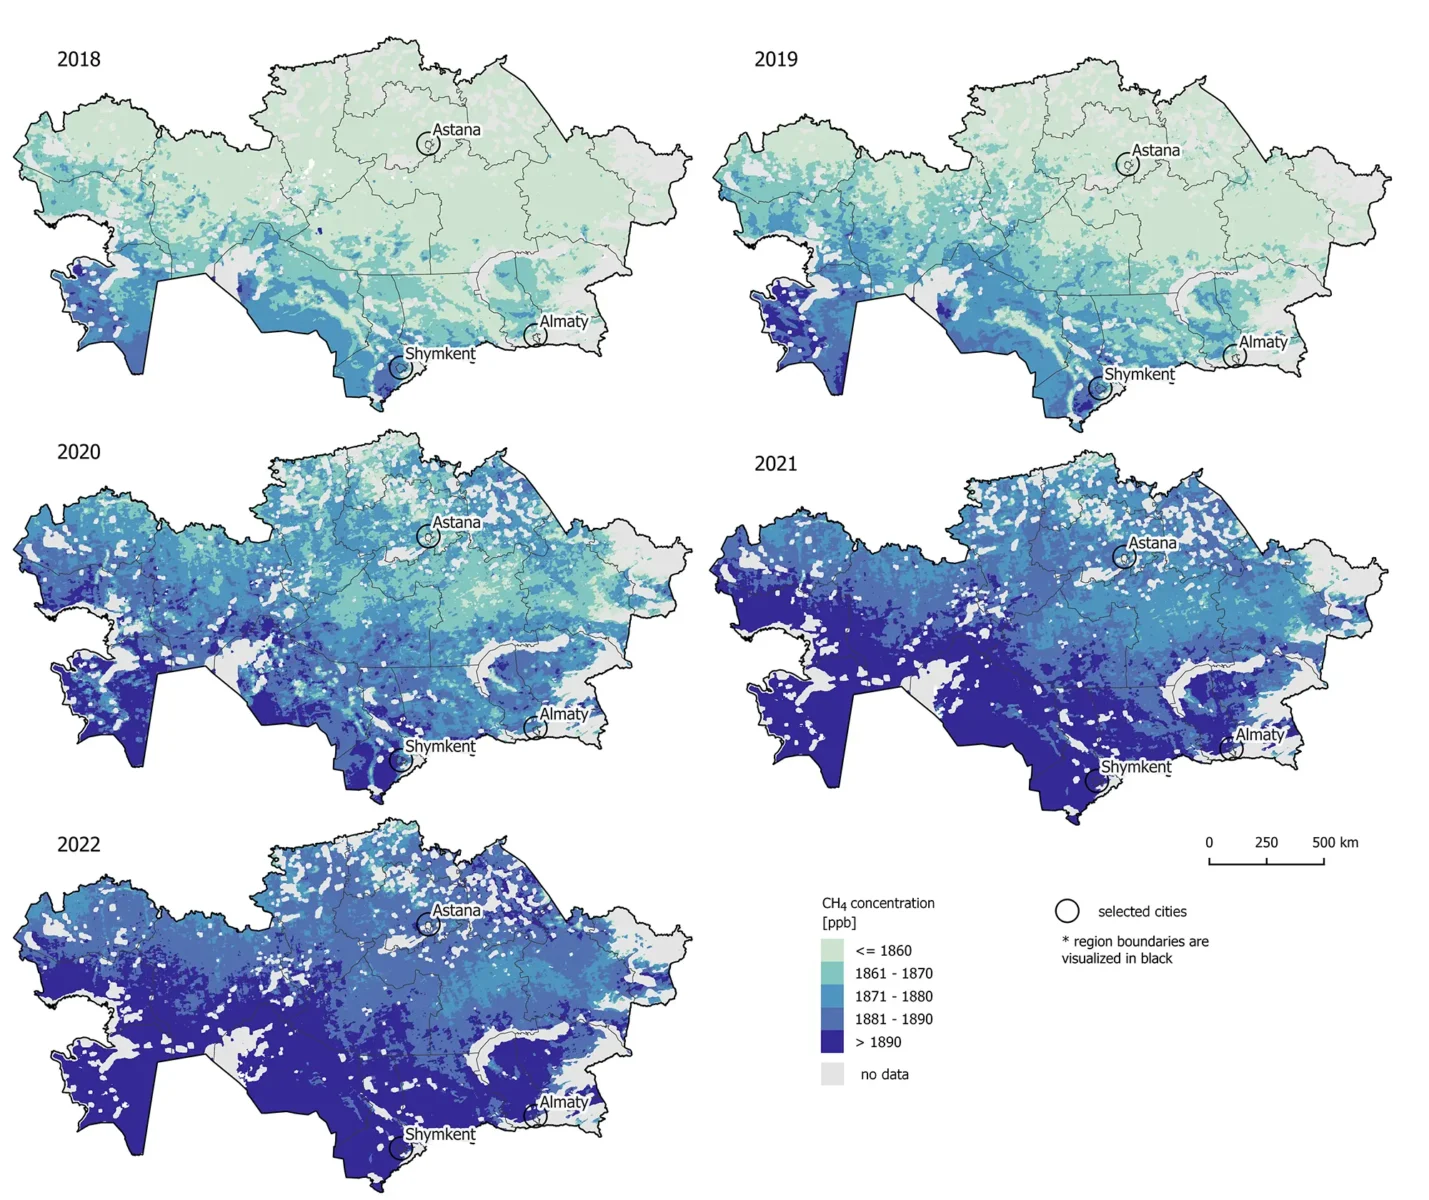
Methane (CH4)
Kazakhstan’s coal, oil, and gas industries capture less methane compared to countries like the US or Ukraine.
The average methane increase (9.2 ppb per year) aligns with global trends.
CH4 levels are highest in arid areas with little vegetation, peaking in autumn and lowest in spring.
Mangystau (Region)
Conc. CH4 (parts per billion: ppb) – 1895
Major sources: Mainly in the south, natural processes in deserts and from gas and oil fields.
Shymkent (City)
Conc. CH4 (parts per billion: ppb) – 1895
Major sources: Crossborder emissions from Uzbekistan, natural sources from deserts also coal mining.
Turkistan (Region)
Conc. CH4 (parts per billion: ppb) – 1890
Major sources: Crossborder emissions from Uzbekistan, natural sources in deserts and coal mining.
Fig. 6: Average yearly CH4 concentrations in Kazakhstan between May 2018 and December 2022, obtained from the Sentinel-5P satellite. Sources: Copernicus Sentinel data (ESA, 2018–2022; modified); OpenStreetMap contributors, 2022. (The S-5P satellite struggles to measure CH4 accurately around large bodies of water and frozen areas resulting in a lack of valid data.)
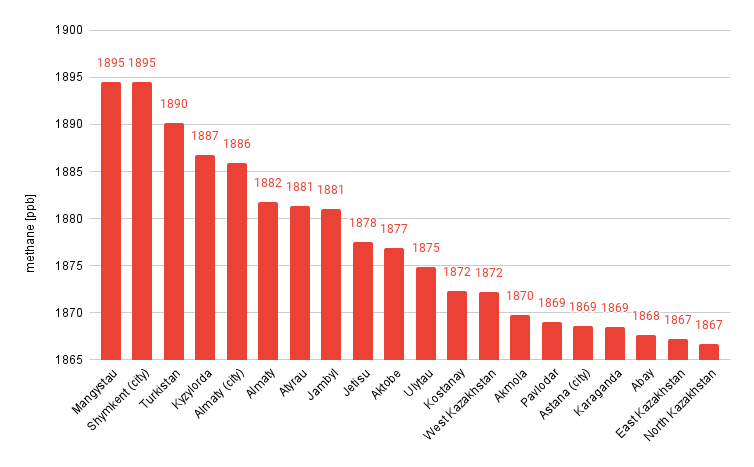
Fig. 7: Average CH4 concentrations in the regions of Kazakhstan between May 2018 and December 2022, obtained from the Sentinel-5P satellite. Source: Copernicus Sentinel data (ESA, 2018–2022; modified).
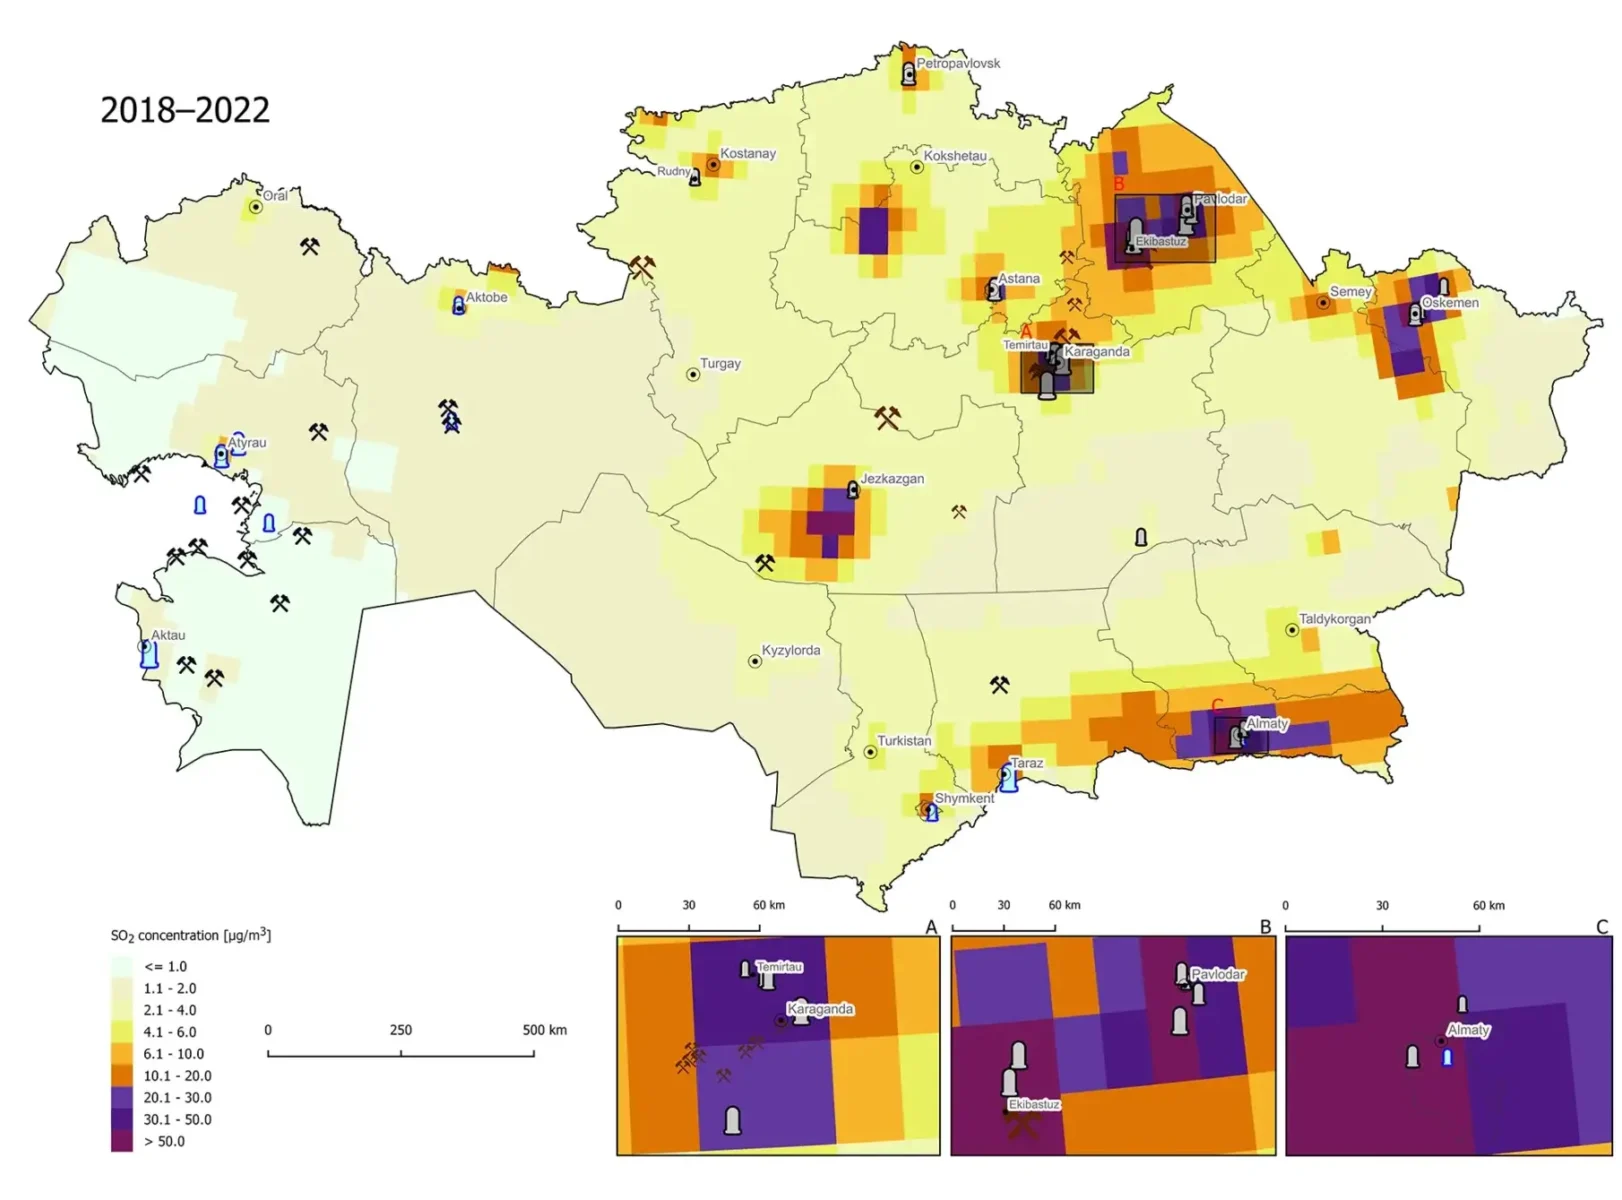
Sulphur Dioxide (SO2)
The highest concentrations were recorded in Ekibastuz, home to the country’s most powerful coal plant.
Lockdown in 2020 led to a temporary SO2 reduction, but concentrations remain highest in Almaty and Pavlodar.
Peaks in winter, but pollution exceeds national limits even in summer.
Almaty (City)
Conc. SO2 (ug/m3) – 25.0
Major sources: Coal mining and coal-fired power plants, crossborder emissions from neighbours.
Astana (City)
Conc. SO2 (ug/m3) – 17.0
Major sources: Metallurgy and coal mining, coal-fired plants, transport, domestic heating.
There was a general reduction in overall SO2 emissions due to lockdowns and reduction of operations.
Pavlodar (Region)
Conc. SO2 (ug/m3) – 16.7
Major sources: Coal mining (Open pit mines, Severny and Bogatyr), coal-fired power plants (the largest in Kazakhstan in Ekibastuz)
Fig. 8: Average SO2 concentrations in Kazakhstan between May 2018 and December 2022 (top) and January 2020 and December 2022 (bottom), obtained from the Copernicus Atmosphere Monitoring Service. Source: Copernicus Atmosphere Monitoring Service data (CAMS, 2022); OpenStreetMap contributors, 2022; Global Energy Monitor, 2022.
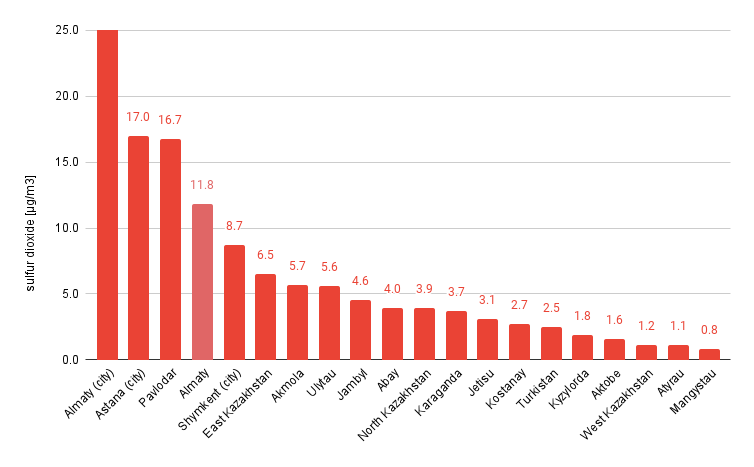
Fig. 9: Average SO2 concentrations in the regions of Kazakhstan between May 2018 and December 2022, obtained from the Copernicus Atmosphere Monitoring Service. Sources: Copernicus Atmosphere Monitoring Service data (CAMS, 2022); OpenStreetMap contributors, 2022.
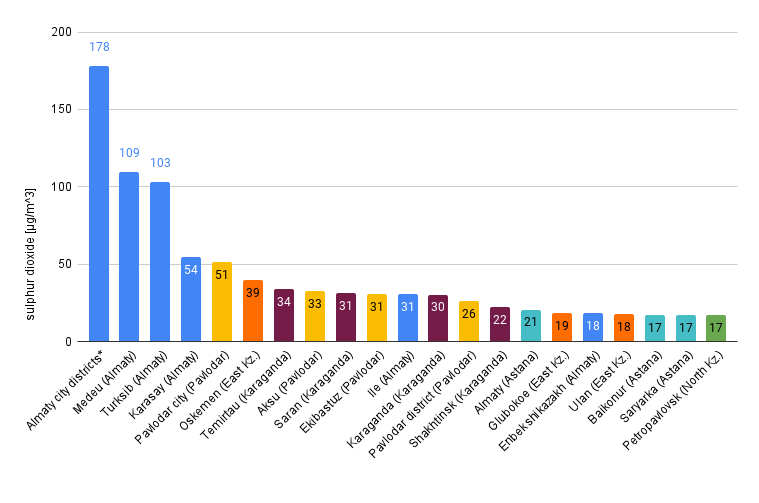
Fig. 10: The 20 highest SO2 concentrations in the districts of Kazakhstan (with indication of the region – the columns are coloured, each colour refers to a region of the country) between May 2018 and December 2022; Copernicus Atmosphere Monitoring Service data. Sources: Copernicus Atmosphere Monitoring Service data (CAMS, 2022); OpenStreetMap contributors, 2022. Note (*): “Almaty city districts” include six districts in the city of Almaty – Alatau, Almaty, Auezov, Bostandyk, Jetysu, Nauryzbay.
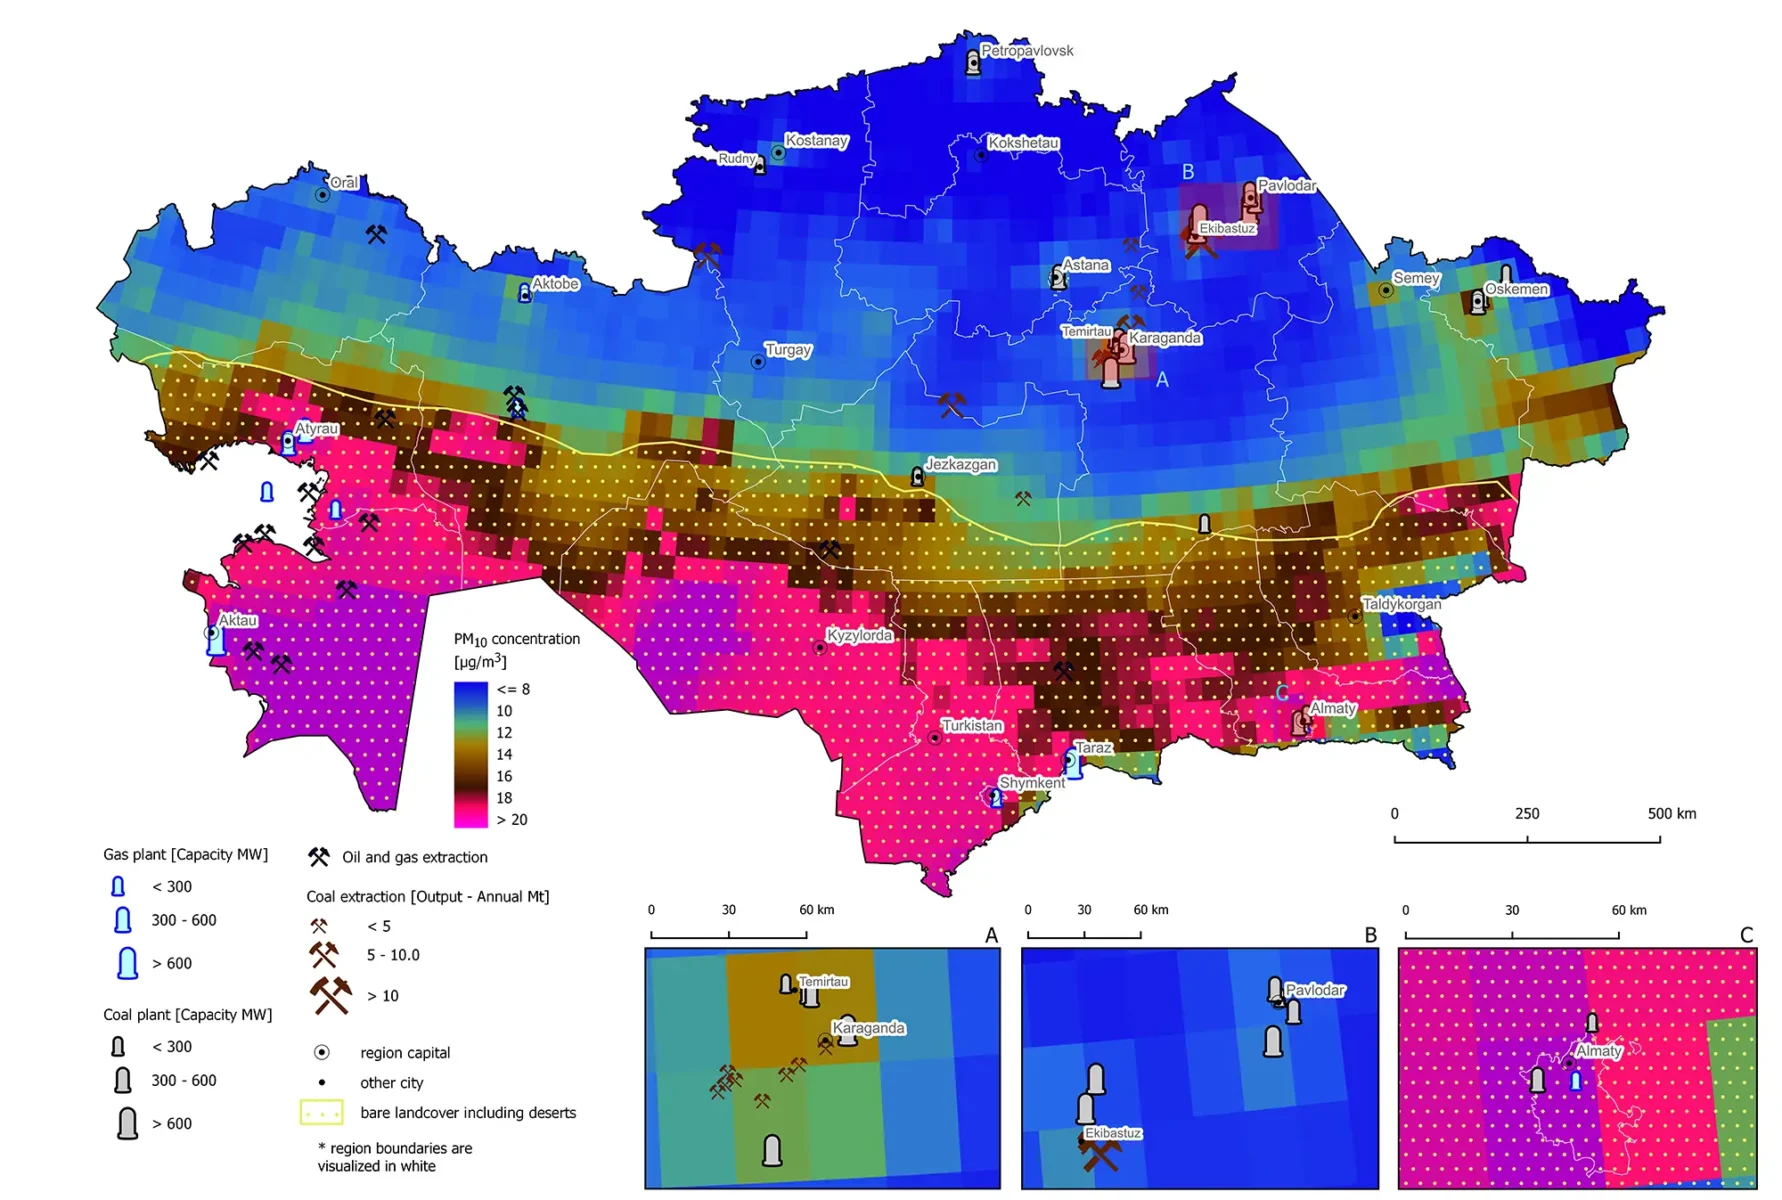
Particulate Matter (PM10)
High PM10 levels occur in the south and southeast due to natural sources like dust storms.
Severe dust storms can raise PM10 levels beyond 1000 µg/m³.
The Mangystau Region has the highest yearly PM10 levels.
Seasonal peaks occur in spring and summer, with some areas influenced by human activity.
Almaty (City)
Conc. particulate matter (ug/m3) – 35.6
Major sources: Metallurgy and coal mining, coal-fired plants, transport, domestic heating, major natural source dust storms.
Shymkent (City)
Conc. particulate matter (ug/m3) – 28.0
Major sources: Coal mining, coal-fired power plants, major natural source dust storms, crossborder from neighbours.
Mangystau (Region)
Conc. particulate matter (ug/m3) – 61.6
Major sources: Crossborder emissions from neighbours, transport. Major natural source in the south (below the yellow line on the map), dust storms in arid areas in mainly desert areas, seasonal variations.
Fig. 11: Median PM10 concentrations in Kazakhstan between May 2018 and December 2022, obtained from the Copernicus Atmosphere Monitoring Service. The cities that are focused on are A) Karaganda, B) Pavlodar, C) Almaty. Sources: Copernicus Atmosphere Monitoring Service data (CAMS, 2022); OpenStreetMap contributors, 2022; European Commission, 2022.
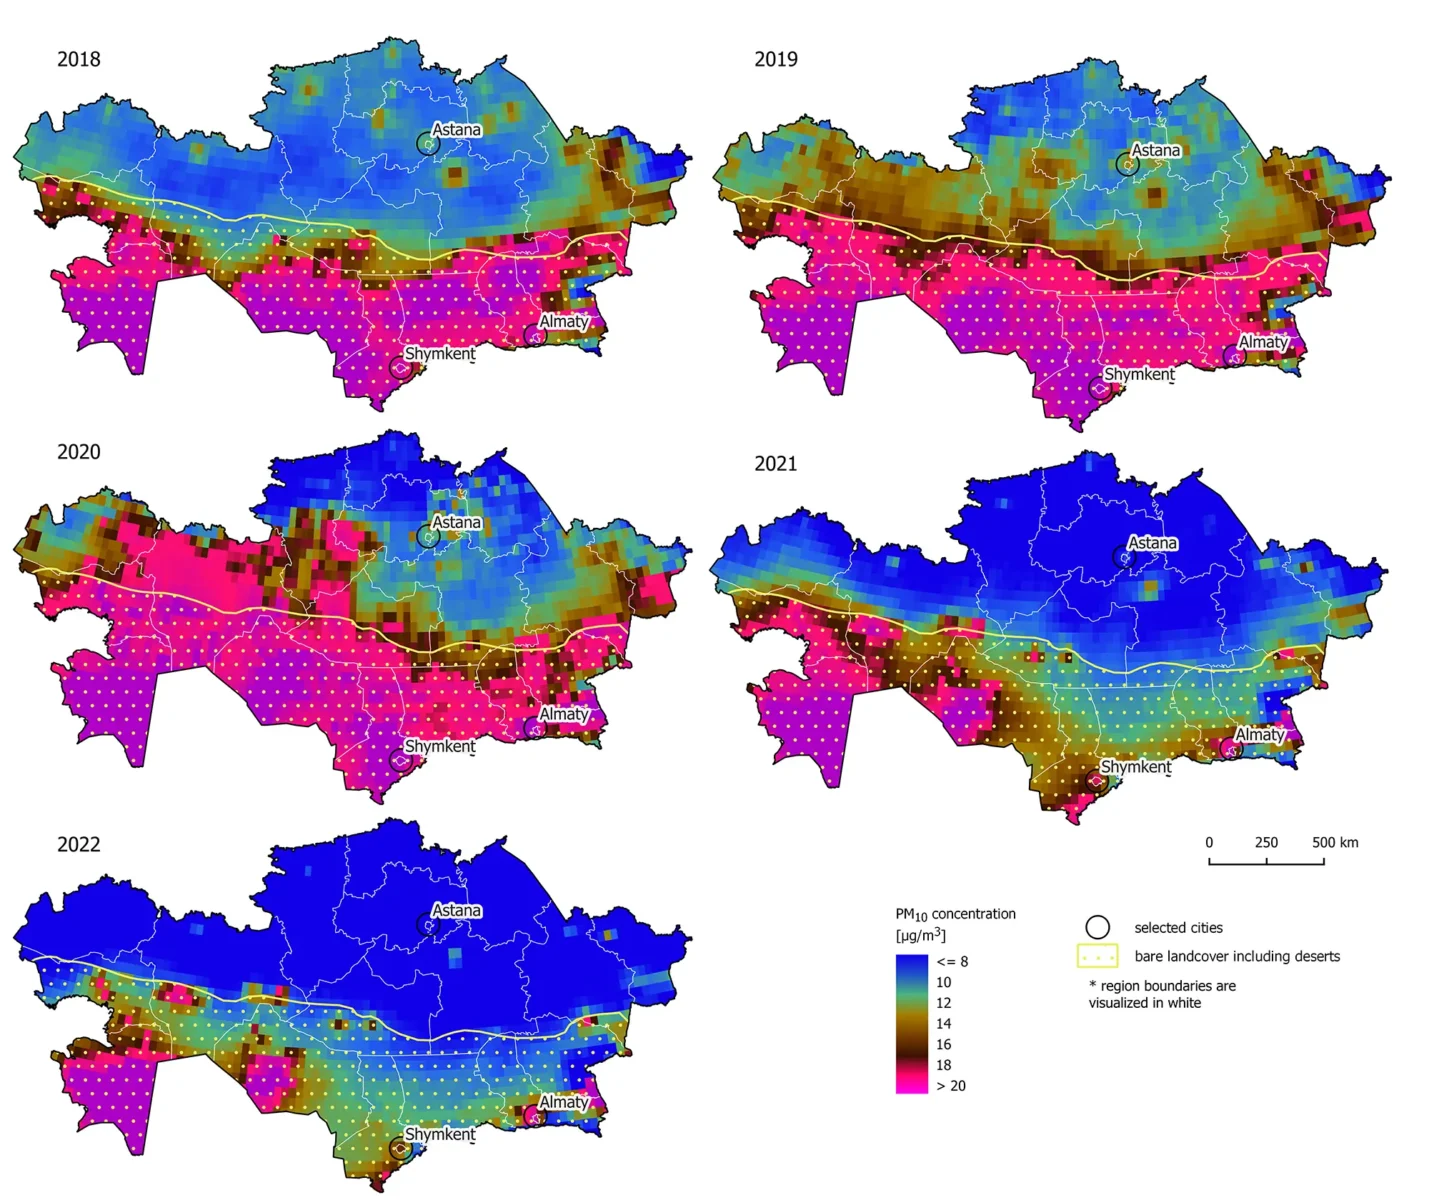
Fig. 12: Median yearly PM10 concentrations in Kazakhstan between May 2018 and December 2022, obtained from the Copernicus Atmosphere Monitoring Service. Sources: Copernicus Atmosphere Monitoring Service data (CAMS, 2022); OpenStreetMap contributors, 2022; European Commission, 2022.
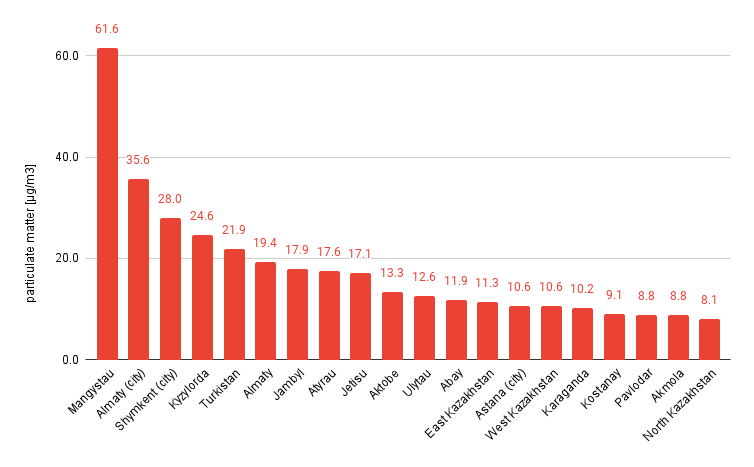
Fig. 13: Median PM10 concentrations in the regions of Kazakhstan between May 2018 and December 2022, obtained from the Copernicus Atmosphere Monitoring Service. Sources: Copernicus Atmosphere Monitoring Service data (CAMS, 2022); OpenStreetMap contributors, 2022.
Kazakhstan’s air pollution is largely driven by industrial emissions, fossil fuels, and natural dust storms, requiring stricter environmental controls and sustainable energy transitions.
AIR POLLUTION IN THE KARAGANDA REGION: SUMMARY
Overview
Karaganda is Kazakhstan’s fourth-largest city, covering ~239,000 sq. km with 1.3 million residents.
The region has rich mineral resources, including coal, iron, and copper, and is home to major industries like chemicals and machinery.
Nitrogen Dioxide (NO2)
Saran (District)
Conc. NO2 (10-4 mol/m2) – 0.37
Major sources: Coal mining, coal-fired power plants, metallurgy, transport, domestic heating (winter).
Karaganda (District)
Conc. NO2 (10-4 mol/m2) – 0.43
Major sources: Coal mining, coal-fired power plants, transport, domestic heating (winter), metallurgy.
Temirtau (District)
Conc. NO2 (10-4 mol/m2) – 0.45
Major sources: Coal mining activites and coal-fired power plants, transport (badly maintained and old vehicles), domestic heating (in winter). Major source: ArcelorMittal Temirtau steel plant, the largest plant in Kazakhstan.
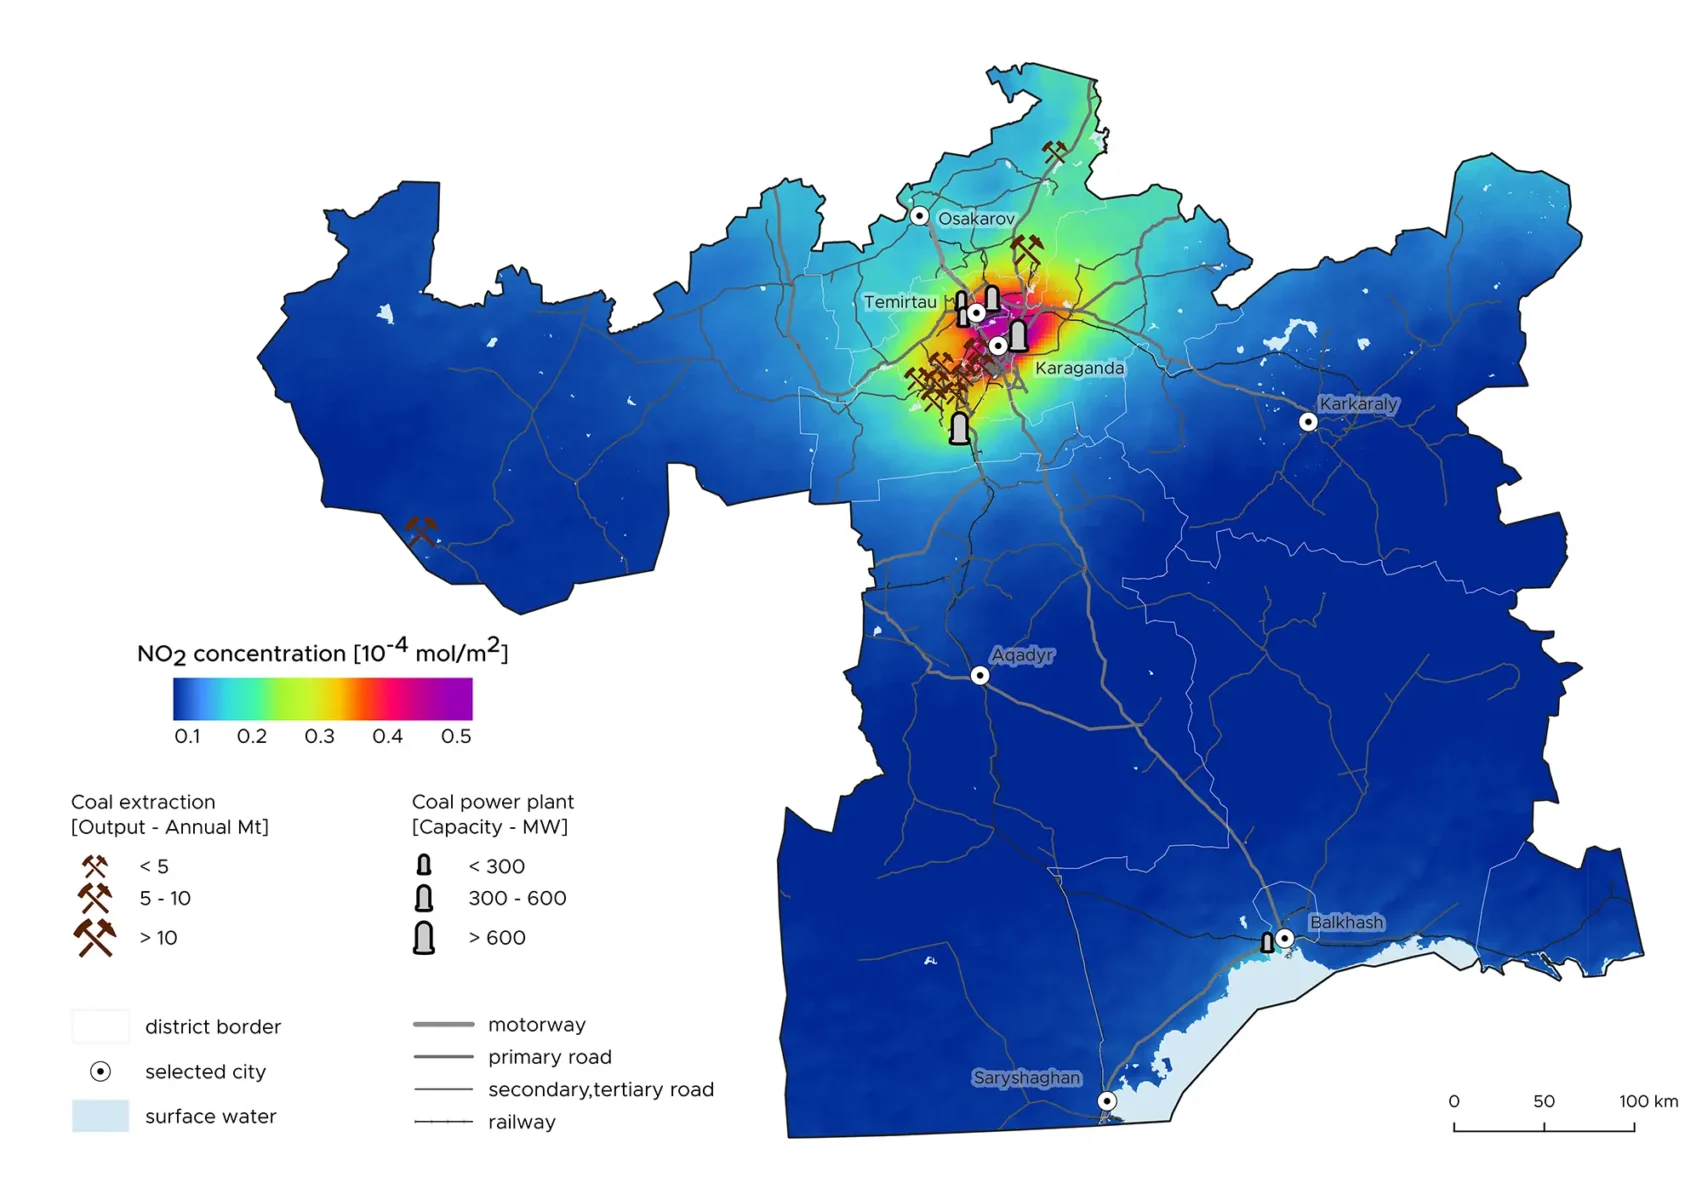
Fig. 14: Average NO2 concentrations in the Karaganda Region between 2018 and 2022, obtained from the Sentinel-5P satellite. Sources: Copernicus Sentinel data (ESA, 2018–2022; modified); OpenStreetMap contributors, 2022; Global Energy Monitor, 2022.
The ArcelorMittal Temirtau steel plant is the region’s largest NO2 polluter, with homes located just 500m away.
High NO2 concentrations are observed, particularly around Temirtau.
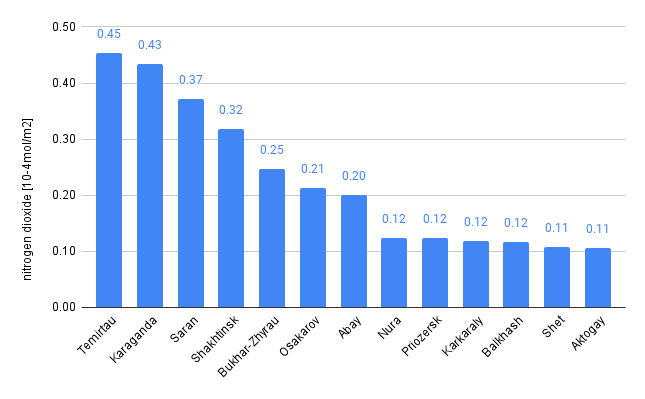
Fig. 15: Average NO2 concentrations calculated for each district of the Karaganda Region using Sentinel-5P satellite data. Sources: Copernicus Sentinel data (ESA, 2018–2022; modified); HDX, 2022.
Methane (CH4)
Saran (District) –
Conc. CH4 (parts per billion: ppb) – 1878
Major sources: Coal mining, coal-fired power plants,
Karaganda (District)
Conc. CH4 (parts per billion: ppb) – 1876
Major sources: Coal mining, coal-fired power plants, metallurgy (ArcelorMittal Temirtau JSC steel), chemical industry, natural occuring sources.
Oskarov (District)
Conc. CH4 (parts per billion: ppb) – 1871
Major sources: Natural sources, coal mining and coal-fired plants.
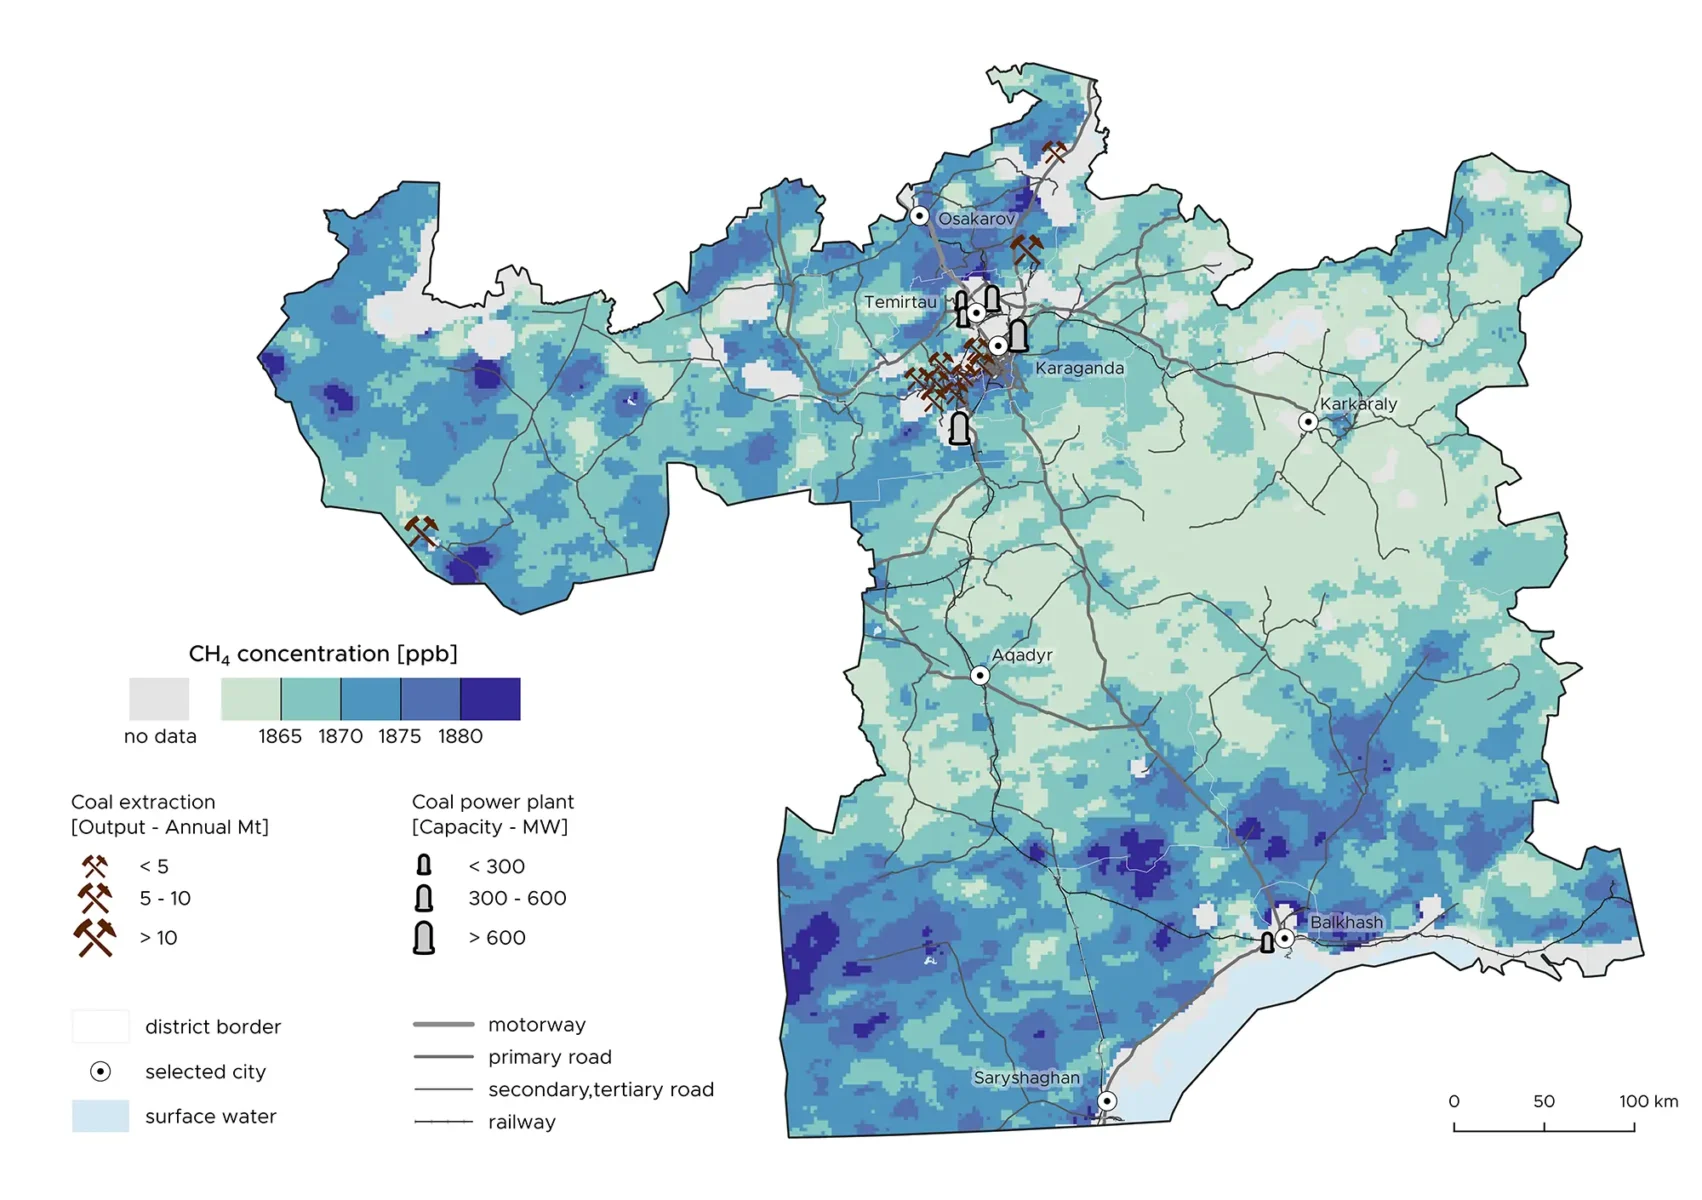
Fig. 16: Average CH4 concentrations in the Karaganda Region between 2018 and 2022, obtained from the Sentinel-5P satellite. Sources: Copernicus Sentinel data (ESA, 2018–2022; modified); OpenStreetMap contributors, 2022; Global Energy Monitor, 2022. (The S-5P satellite struggles to measure CH4 accurately around large bodies of water and frozen areas resulting in a lack of valid data.)
Data limitations affect readings in Priozersk and Temirtau due to water proximity and seasonal freezing.
The region has moderate methane emissions from industrial and mining activities.
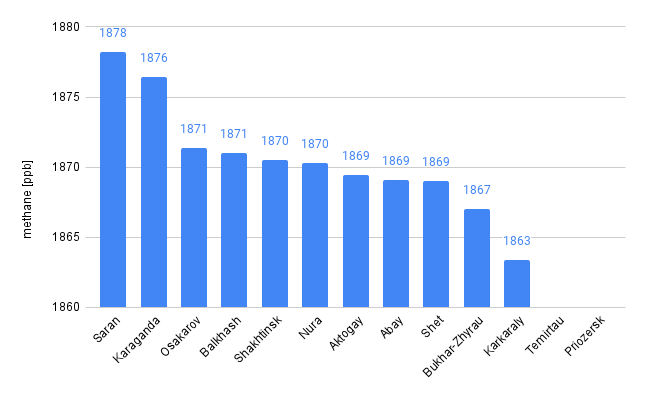
Fig. 17: Average CH4 concentrations calculated for districts of the Karaganda Region using Sentinel-5P satellite data. Sources: Copernicus Sentinel data (ESA, 2018–2022; modified); HDX, 2022.
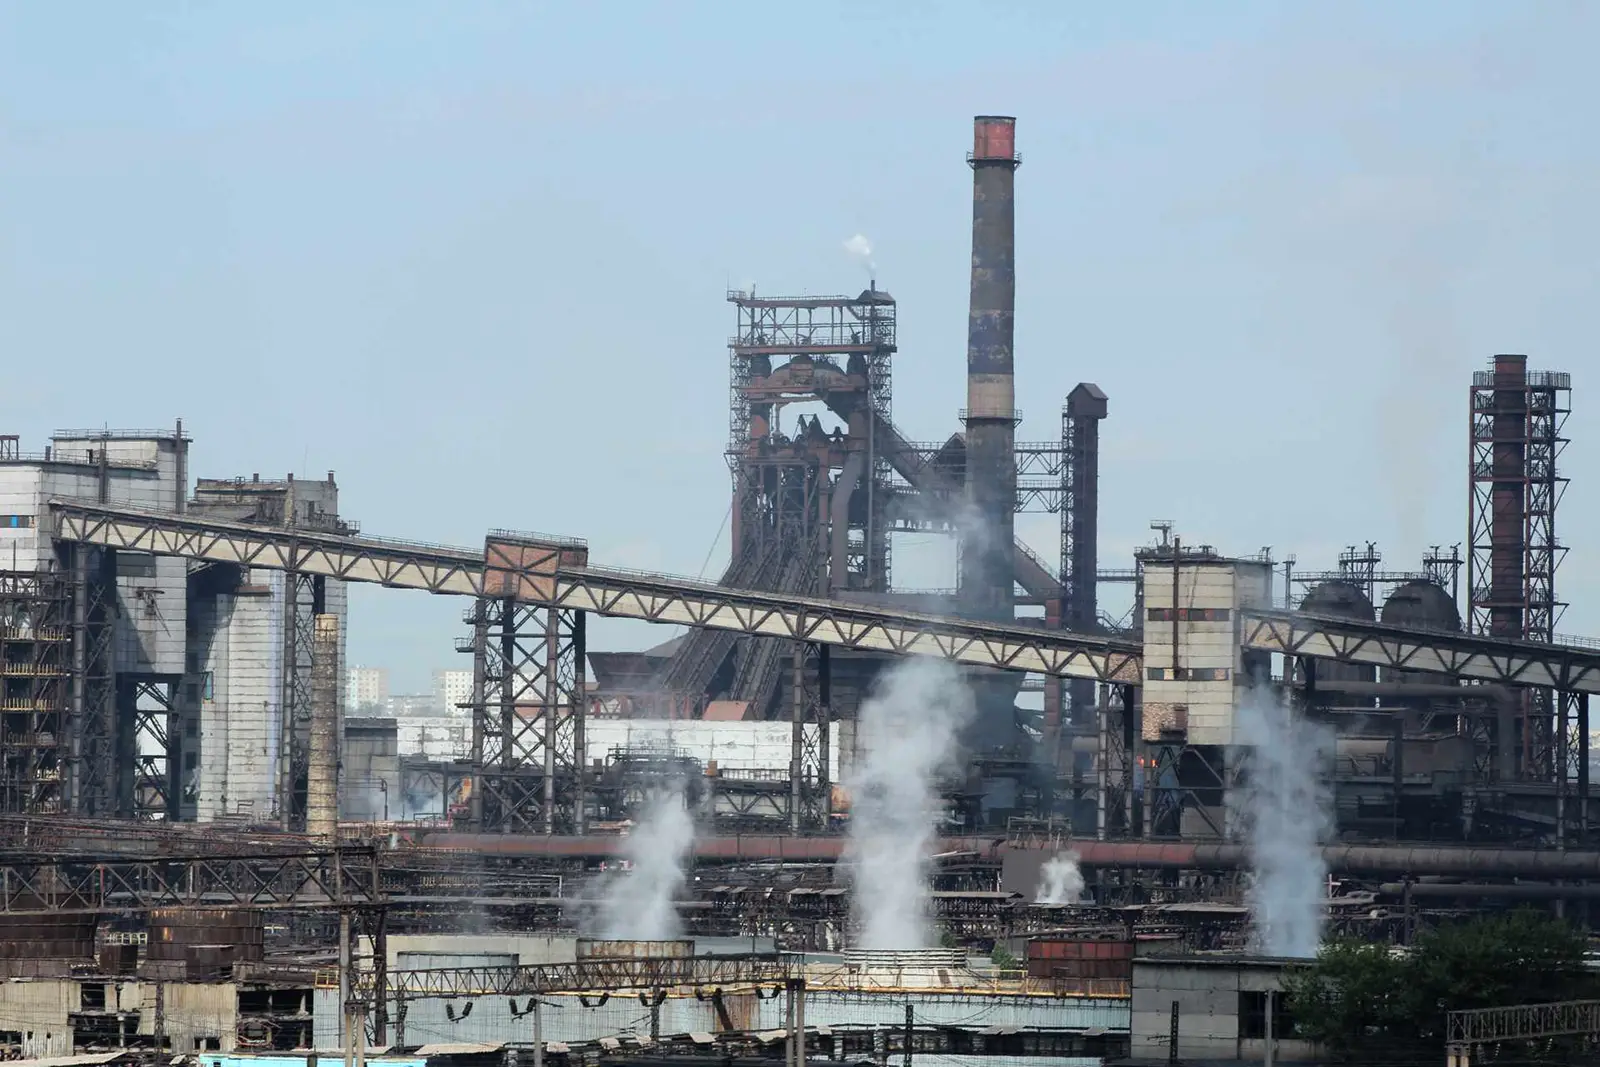
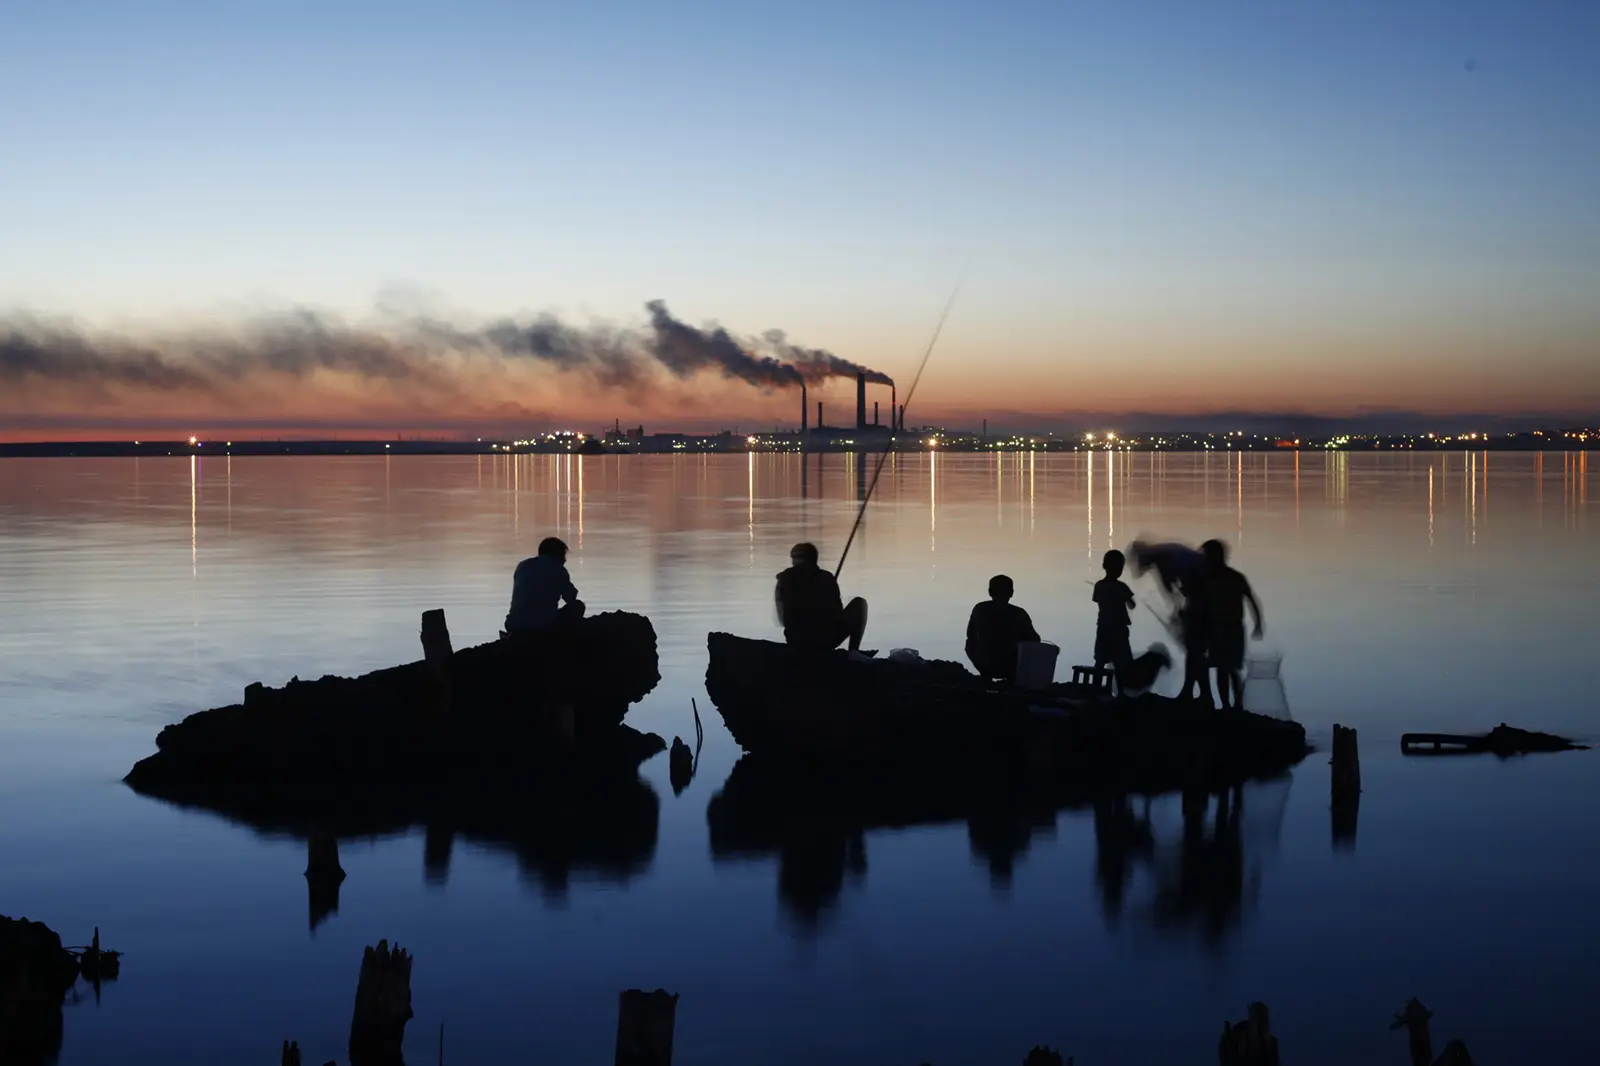
Obsolete technologies in heavy industry, not complying to the up-to-date standards, are one of the main reasons of excess air pollution. ArcelorMittal Temirtau. (Photo: Ondrej Petrlik / Arnika)
Sulphur Dioxide (SO2)
Saran (District)
Conc. SO2 (ug/m3) – 30.21
Major sources: Metallurgy and coal mining, coal-fired plants, transport, domestic heating.
Karaganda (District)
Conc. SO2 (ug/m3) – 29.84
Major sources: Coal mining, coal-fired power plants, transport, domestic heating (winter), metallurgy.
Temirtau (District)
Conc. SO2 (ug/m3) – 32.88
Major sources: Coal mining and coal-fired power plants, metallurgy (ArcelorMittal Temirtau JSC steel, largest plant in KZ), transport and domestic heating (winter – “Black snow” events regularly).
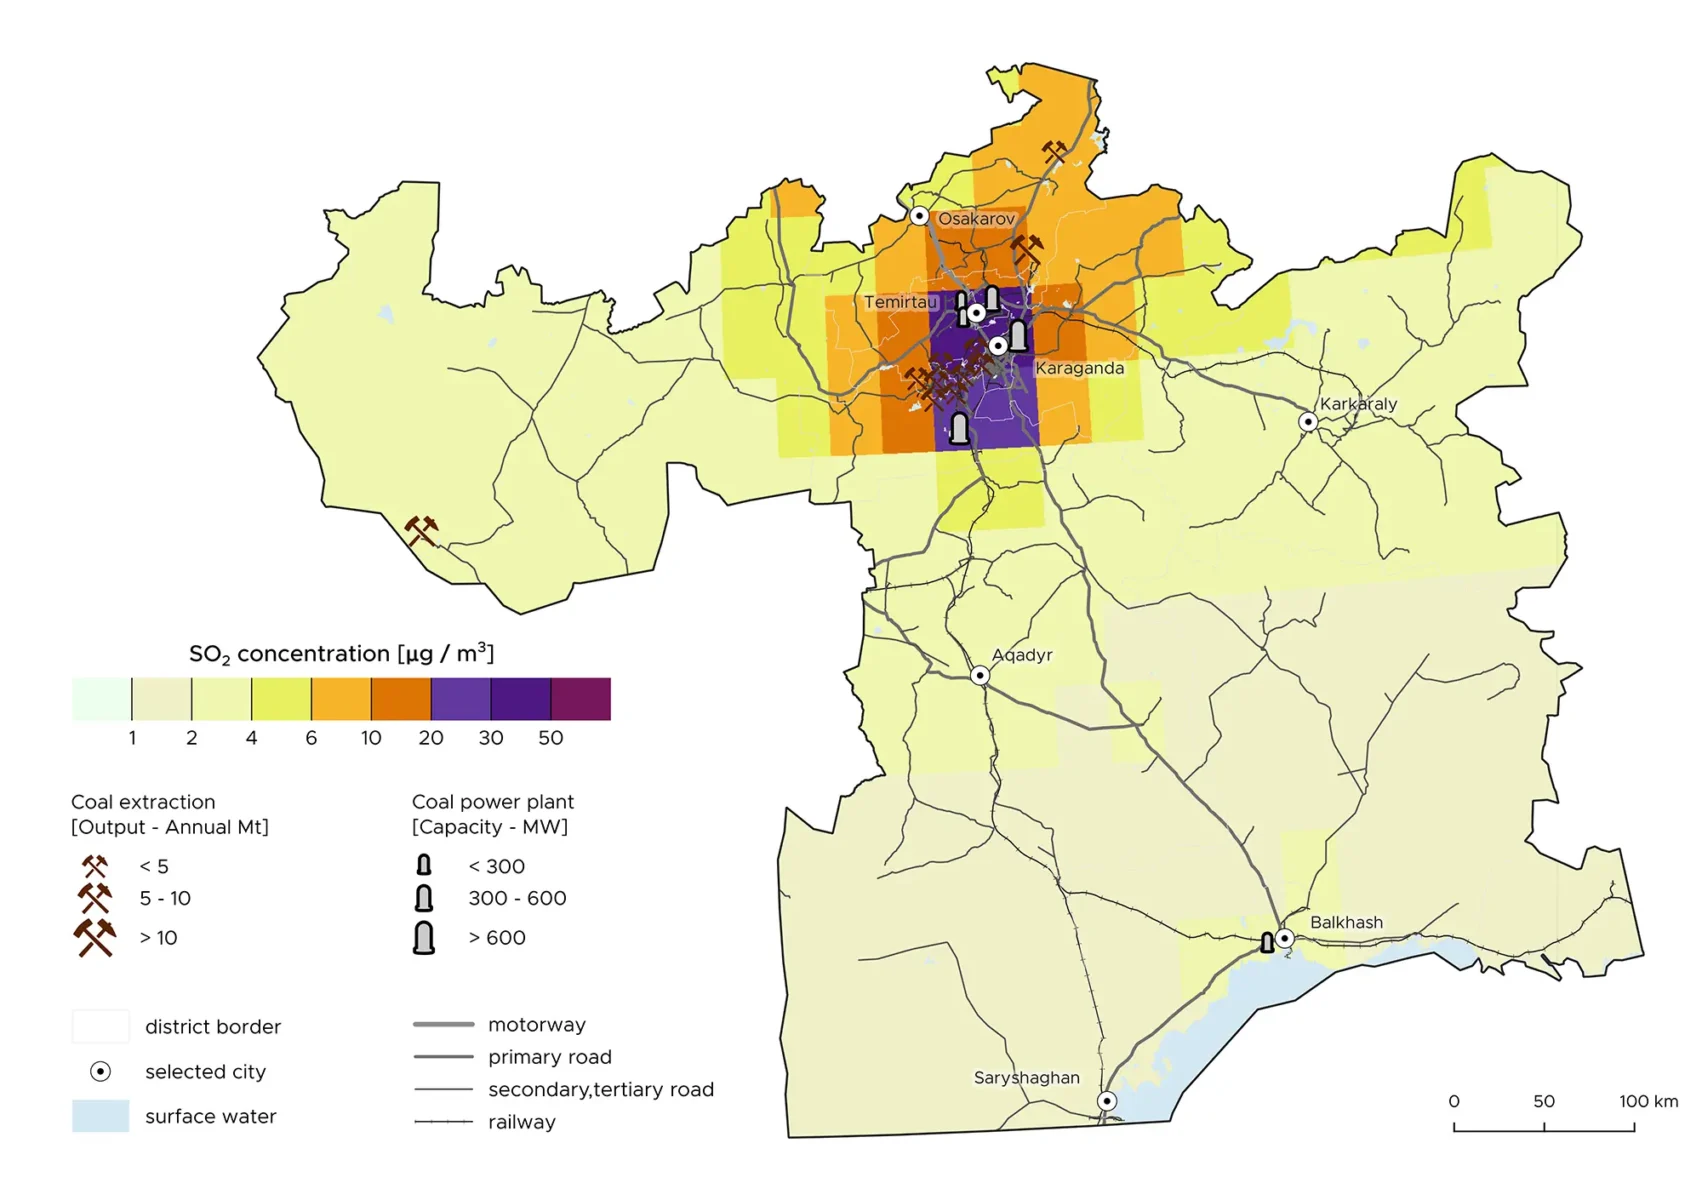
Fig. 18: Average SO2 concentrations in the Karaganda Region between 2018 and 2022, obtained from the Copernicus Atmosphere Monitoring Service. Sources: Copernicus Atmosphere Monitoring Service data (CAMS, 2022); OpenStreetMap contributors, 2022; Global Energy Monitor, 2022.
Major sources include industrial operations and coal processing.
High SO2 concentrations are recorded across multiple districts.
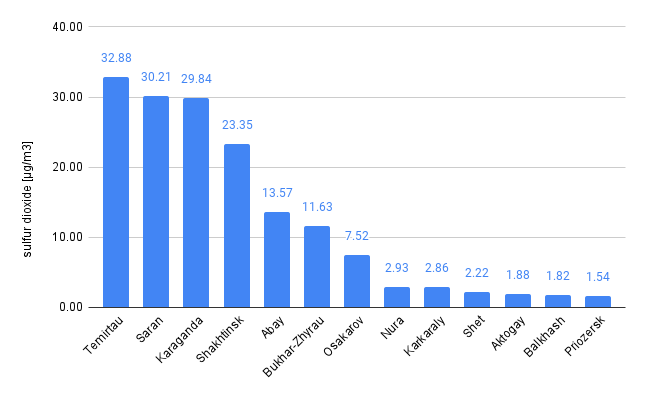
Fig. 19: Average SO2 concentrations calculated for each district of the Karaganda Region, obtained from the Copernicus Atmosphere Monitoring Service. Sources: Copernicus Atmosphere Monitoring Service data (CAMS, 2022); OpenStreetMap contributors, 2022; HDX, 2022.
Particulate Matter (PM10)
Priozersk (District)
Conc. particulate matter (ug/m3) – 14.61
Major sources: Metallurgy, major natural source dust storms.
Balkash (District)
Conc. particulate matter (ug/m3) – 15.48
Major sources: Coal mining and coal-fired power plants, copper smelter (largest in Kazakhstan) transport. Major natural source in the south, dust storms
Temirtau (District)
Conc. particulate matter (ug/m3) – 13.93
Major sources: Coal mining, coal-fired power plants, metallurgy (ArcelorMittal Temirtau JSC steel plant), transport.
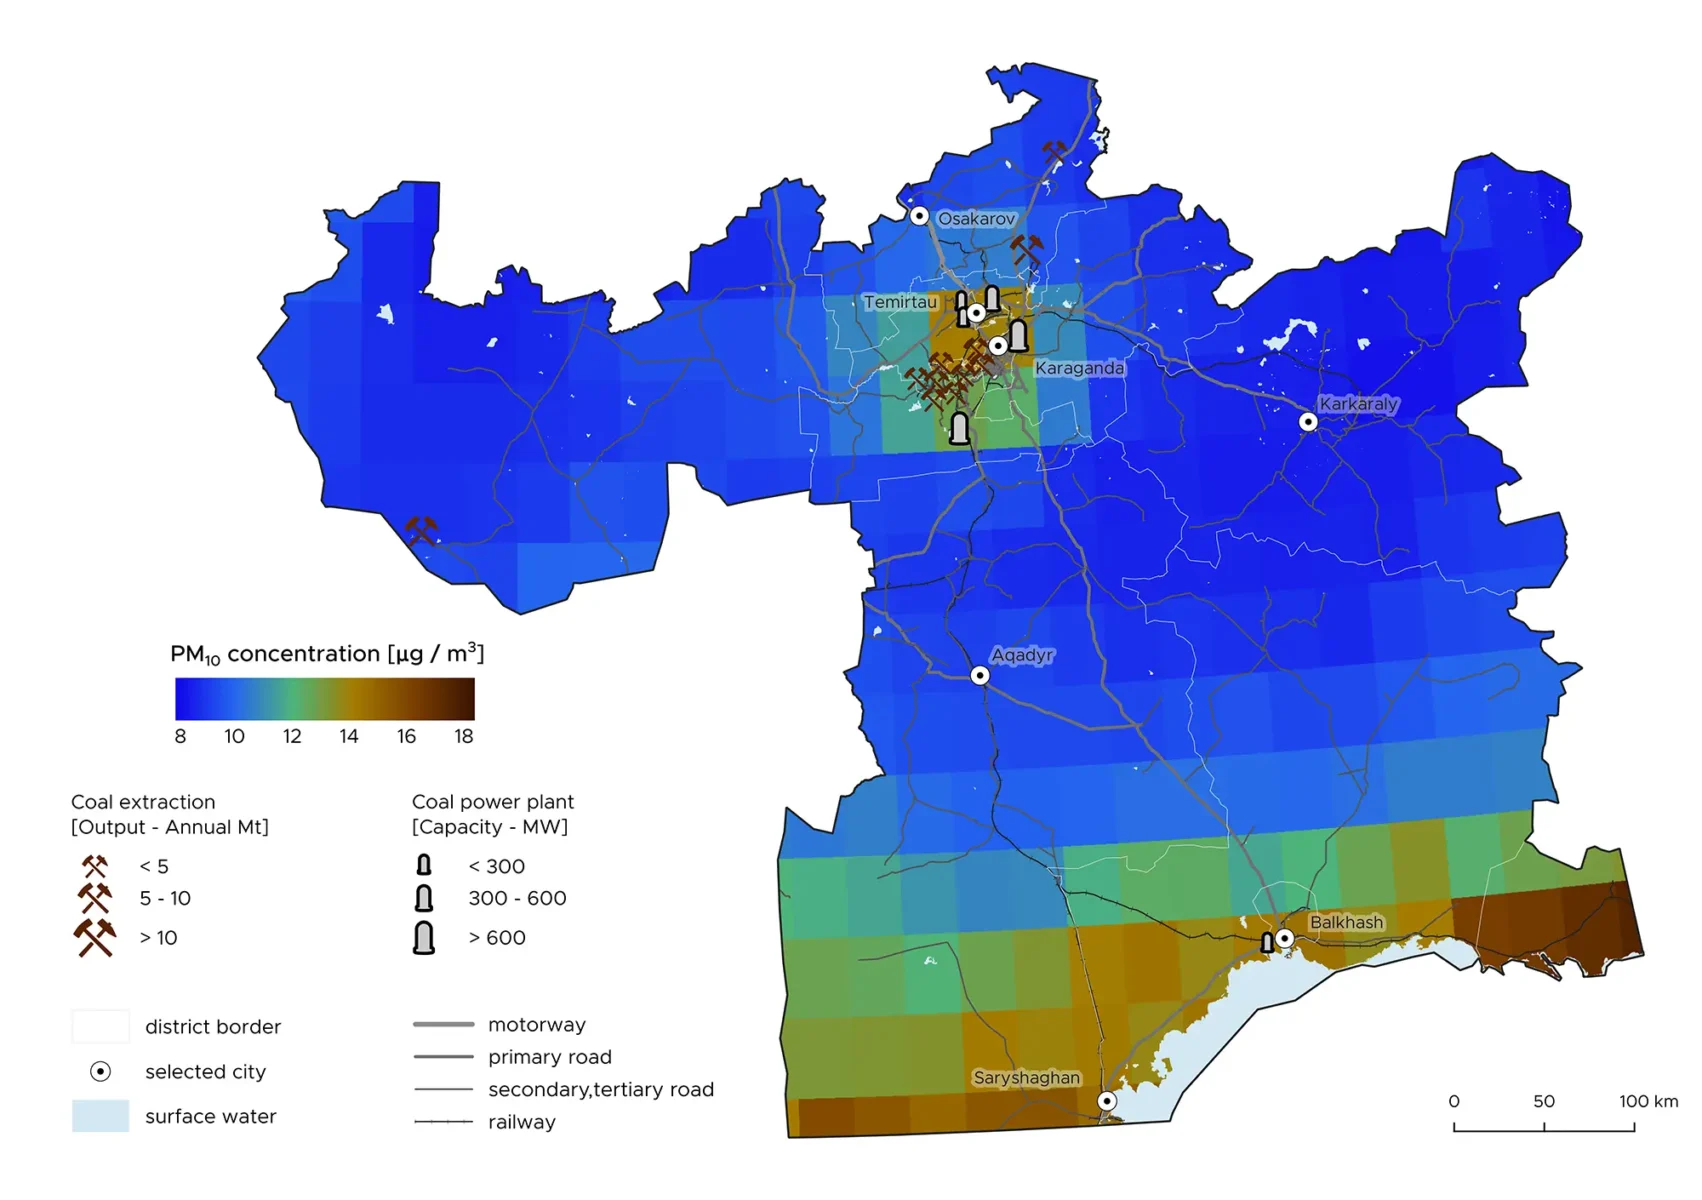
Fig. 20: Average PM10 concentrations in the Karaganda Region between 2018 and 2022, obtained from the Copernicus Atmosphere Monitoring Service. Sources: Copernicus Atmosphere Monitoring Service data (CAMS, 2022); OpenStreetMap contributors, 2022; Global Energy Monitor, 2022.
Southern areas experience increased PM10 in summer due to natural dust sources.
Northern areas show higher pollution from human activities.
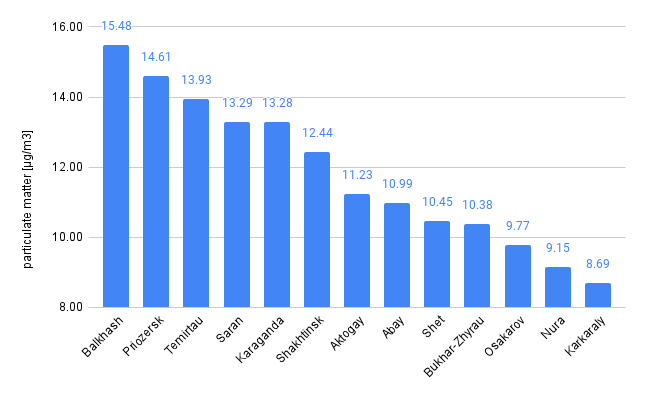
Fig. 21: Average PM10 concentrations calculated for each district of the Karaganda Region using the Copernicus Atmosphere Monitoring Service. Sources: Copernicus Atmosphere Monitoring Service data (CAMS, 2022); OpenStreetMap contributors, 2022; HDX, 2022.
Karaganda’s air pollution is driven by industrial emissions, coal mining, and natural dust, highlighting the need for environmental regulation and pollution control measures.
RECOMMENDATIONS
Strengthen Air Quality Monitoring
Expand the National Air Quality Monitoring Network (NAQMN) and unify data validation under a single authority.
Promote citizen monitoring networks and ensure real-time, user-friendly data access.
Enhance satellite monitoring for comprehensive air pollution tracking.
Reduce Coal Dependence & Expand Renewable Energy
Stop new fossil fuel power plants and develop a coal phase-out plan.
Reduce flaring and venting in the oil and gas sector.
Invest in solar, wind energy, and efficient district heating systems to replace coal reliance.
Strengthen Regulations & Enforcement
Improve implementation of environmental laws and climate policies (e.g., Kazakhstan 2050 Strategy).
Impose stricter penalties for non-compliance and establish bilateral agreements with Russia and Uzbekistan.
Develop Clean Air Plans at national and regional levels.
Enhance Industrial Emission Controls
Implement energy efficiency measures and encourage Best Available Techniques (BAT) in industries.
Develop sector-specific roadmaps and establish a Pollution Release and Transfer Register (PRTR).
Enforce emission quotas for polluting industries.
Increase Public Awareness & Engagement
Promote sustainable transport and reduce reliance on old, inefficient cars.
Raise awareness about clean heating alternatives to replace polluting fuels.
Implement an early warning system for air pollution events.
Specific Recommendations for the Karaganda Region
Prioritise coal-related industries by enforcing strict emission controls and adopting cleaner technologies.
Reduce dust emissions from coal mines and industrial operations.
Improve air quality monitoring and involve citizens in spatial planning, environmental impact assessments, and policy decisions.